The US dollar (USD) is currently facing headwinds, driven by renewed concerns regarding national debt amid debates over significant fiscal policies, specifically President Donald Trump's proposed spending measures which may contribute an estimated $3.3 trillion to the national deficit over the next ten years. This sentiment shift has resulted in the USD's sluggish performance, especially as anticipated economic indicators suggest a cooling labor market and contractions in the manufacturing sector. Analysts indicate that such factors may bolster speculations around Federal Reserve interest rate cuts, potentially exerting further pressure on the USD.
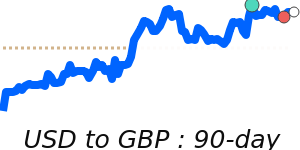
In recent months, the dollar has reached notable lows against key currencies. The USD to EUR exchange rate is currently hovering around 0.8482, which is 3.7% below its three-month average of 0.881 and reflects a volatile trading range of 9.2% from 0.8482 to 0.9266. Similarly, the USD to GBP rate stands at 0.7281, approximately 2.7% lower than its three-month average of 0.7486. Even the USD to JPY rate is feeling the pinch, currently at 143.7 — just slightly below its three-month average of 144.5, indicating a steady range with minor fluctuations.
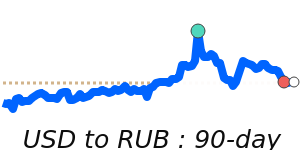
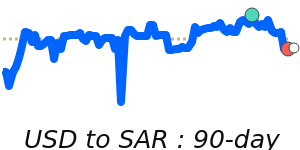
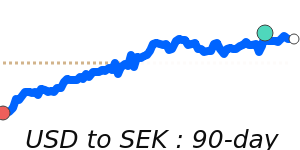
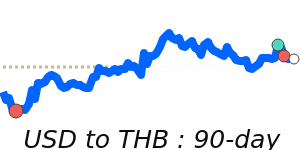
The USD's status as a safe-haven currency typically attracts investments during times of global instability. However, waning risk sentiment, exacerbated by geopolitical tensions and domestic economic concerns, places downward pressure on the dollar. The overall strength of the USD is intricately linked to U.S. monetary policy, inflation, and the fiscal landscape, as well as global trade dynamics influenced by rising oil prices.
At present, oil prices, which have recently stabilized around $67.61 per barrel (1.2% above the three-month average), could play a crucial role in impacting eur/USD exchanges, given the dollar's relationship with commodity pricing. Fluctuations in oil prices generally lead to shifts in the dollar's value, particularly as the USD plays a central role in international transactions.
The outlook for the USD remains contingent on forthcoming economic data releases and the Federal Reserve's policy direction. Investors and businesses operating internationally may wish to monitor these developments closely, as the dollar's forecast hinges on both domestic economic performance and global market stability.