Switch .com Best Exchange Rates .com Best Exchange Rates .com Best Exchange Rates
BER

US dollar Markets

USD Currency Update - Our review of US dollar forecasts and news plus charts and historic rates. Check USD Trends over various time periods.


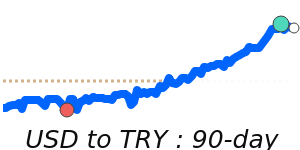
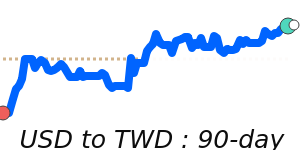
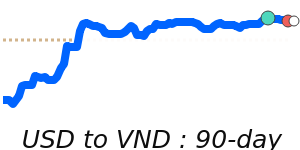
The US dollar (USD) has shown notable strength lately, primarily fueled by safe-haven flows and a recalibration of Federal Reserve interest rate cut expectations. Analysts have noted that recent comments from the Trump administration regarding potential trade deals ahead of the tariff deadline on July 9 may contribute further to the dollar's appreciation.

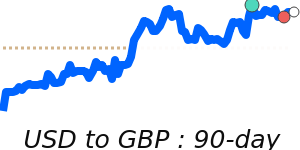
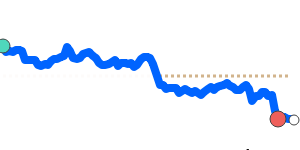
In currency pair movements, the USD reached 14-day highs against the Euro (EUR), now priced at approximately 0.8572, which is 1.9% below its three-month average of 0.8734. Despite this, trading has remained stable within a 6.5% range. Conversely, the USD to British pound (GBP) exchange rate stands near 0.7448, reflecting close alignment with its three-month average while maintaining a steady range. More significantly, the USD to Japanese yen (JPY) is currently at about 147.8, which marks a 60-day high—2.2% above its three-month average of 144.6, supporting the notion that the dollar benefits in times of economic uncertainty.

Economic indicators such as U.S. inflation, employment data, and GDP growth will continue to be pivotal in shaping the dollar’s trajectory. Analysts assert that the Federal Reserve's monetary policy remains crucial; higher interest rates typically allure investors, strengthening the dollar, while a dovish approach may dampen its appeal.

In commodity markets, the oil price, now at 69.21 USD, is 2.9% above its three-month average. With oil being a key commodity priced in dollars, fluctuations in oil prices can significantly impact the demand for the dollar, inherently linking the strength of the currency to global economic sentiments.

Given these dynamics, any disappointment in upcoming trade deals could present headwinds for the dollar. However, the prevailing geopolitical tensions and sustained demand for the safe-haven appeal of USD may continue to support its value in the near term. Investors are advised to keep an eye on Federal Reserve communications, as shifts in policy or rate expectations can result in notable trading volatility.


US Dollar Index - USD/X Trend

 
The U.S. Dollar Index is at 14-day highs near 98.12, just 0.9% below its 3-month average of 98.98, having traded in a quite stable 5.3% range from 96.64 to 101.8
|
 
1 USD =
98.63We compare provider deals to this wholesale mid-market rate. Read more
X
 
+0.1%
14d-highs
 
Track Rate

View My Rate Tracker


Compare & Save on Exchange Rates

Exchange rates can vary significantly between banks and currency exchange providers, so it's important to compare rates from different sources before making a conversion.

The below table makes it easy to calculate and compare the Total Cost you are being charged on currency rates and the possible savings of using a foreign exchange provider rather than your bank.


Loading exchange rates...


Top USD Rates


US dollar to Canadian dollar
USDCAD 90 day chart

USD to CAD is at 14-day highs near 1.3707, just below its 3-month average, having traded in a very stable 3.0% range from 1.3571 to 1.3983
USD to CAD
1.3722
14d-highs

US dollar to Euro
USDEUR 90 day chart

USD to EUR is at 14-day highs near 0.8572, 1.9% below its 3-month average of 0.8734, having traded in a relatively stable 6.5% range from 0.8470 to 0.9019
USD to EUR
0.8619
14d-highs

US dollar to Japanese yen
USDJPY 90 day chart

USD to JPY is at 60-day highs near 147.8, 2.2% above its 3-month average of 144.6, having traded in a quite stable 5.4% range from 140.9 to 148.5
USD to JPY
148.87
+0.4%
60d-highs

US dollar to Mexican peso
USDMXN 90 day chart

USD to MXN is at 7-day highs near 18.75, 2.4% below its 3-month average of 19.22, having traded in a relatively stable 8.0% range from 18.61 to 20.10
USD to MXN
18.82
+0.6%

US dollar to Indian rupee
USDINR 90 day chart

USD to INR is at 14-day highs near 85.98, just above its 3-month average, having traded in a very stable 3.0% range from 84.22 to 86.72
USD to INR
85.99
+0.2%
14d-highs

US dollar to British pound
USDGBP 90 day chart

USD to GBP is at 14-day highs near 0.7448, near its 3-month average, having traded in a quite stable 4.3% range from 0.7275 to 0.7590
USD to GBP
0.7472
+0.5%
14d-highs

US dollar to Australian dollar
USDAUD 90 day chart

USD to AUD at 1.5280 is 1.2% below its 3-month average of 1.5459, having traded in a very stable 3.8% range from 1.5176 to 1.5760
USD to AUD
1.5354
+0.3%

US dollar to Philippine peso
USDPHP 90 day chart

USD to PHP is at 14-day highs near 56.67, just 0.9% above its 3-month average of 56.15, having traded in a very stable 3.5% range from 55.34 to 57.28
USD to PHP
56.85
+0.3%
14d-highs

A-Z


US dollar to Australian dollar
USDAUD 90 day chart

USD to AUD at 1.5280 is 1.2% below its 3-month average of 1.5459, having traded in a very stable 3.8% range from 1.5176 to 1.5760
USD to AUD
1.5354
+0.3%

US dollar to Brunei dollar
USD to BND is at 14-day highs near 1.2809, just 0.8% below its 3-month average of 1.2917, having traded in a very stable 3.6% range from 1.2709 to 1.3170
USD to BND
1.2820
+0.1%
14d-highs

US dollar to Brazilian real
USDBRL 90 day chart

USD to BRL is at 30-day highs near 5.5885, just below its 3-month average, having traded in a fairly volatile 8.8% range from 5.4096 to 5.8854
USD to BRL
5.5576
+0.5%
30d-highs

US dollar to Canadian dollar
USDCAD 90 day chart

USD to CAD is at 14-day highs near 1.3707, just below its 3-month average, having traded in a very stable 3.0% range from 1.3571 to 1.3983
USD to CAD
1.3722
14d-highs

US dollar to Swiss franc
USDCHF 90 day chart

USD to CHF at 0.7978 is 2.4% below its 3-month average of 0.8172, having traded in a relatively stable 6.9% range from 0.7911 to 0.8455
USD to CHF
0.8019

US dollar to Chilean peso
USDCLP 90 day chart

USD to CLP at 968.5 is 2.7% above its 3-month average of 942.9, having traded in a quite stable 4.8% range from 926.0 to 970.0
USD to CLP
967.37
+1.2%
60d-highs

US dollar to Chinese yuan
USDCNY 90 day chart

USD to CNY is at 7-day lows near 7.1680, just 0.6% below its 3-month average of 7.2125, having traded in a very stable 2.1% range from 7.1641 to 7.3145
USD to CNY
7.1730

US dollar to Czech Republic horuna
USDCZK 90 day chart

USD to CZK is at 14-day highs near 21.15, 2.6% below its 3-month average of 21.71, having traded in a relatively stable 7.8% range from 20.90 to 22.52
USD to CZK
21.26
14d-highs

US dollar to Danish krone
USDDKK 90 day chart

USD to DKK is at 14-day highs near 6.3988, 1.8% below its 3-month average of 6.5172, having traded in a relatively stable 6.5% range from 6.3200 to 6.7285
USD to DKK
6.4328
14d-highs

US dollar to Egyptian pound
USDEGP 90 day chart

USD to EGP is at 7-day lows near 49.45, 1.3% below its 3-month average of 50.13, having traded in a very stable 3.8% range from 49.26 to 51.13
USD to EGP
49.41
-0.1%

US dollar to Euro
USDEUR 90 day chart

USD to EUR is at 14-day highs near 0.8572, 1.9% below its 3-month average of 0.8734, having traded in a relatively stable 6.5% range from 0.8470 to 0.9019
USD to EUR
0.8619
14d-highs

US dollar to Fijian dollar
USDFJD 90 day chart

USD to FJD at 2.2493 is just below its 3-month average, having traded in a very stable 3.2% range from 2.2327 to 2.3048
USD to FJD
2.2564
+0.2%

US dollar to British pound
USDGBP 90 day chart

USD to GBP is at 14-day highs near 0.7448, near its 3-month average, having traded in a quite stable 4.3% range from 0.7275 to 0.7590
USD to GBP
0.7472
+0.5%
14d-highs

US dollar to Hong Kong dollar
USDHKD 90 day chart

USD to HKD is at 90-day highs near 7.8502, just above its 3-month average, having traded in a stable 1.3% range from 7.7500 to 7.8502
USD to HKD
7.8499
90d-highs

US dollar to Hungarian forint
USDHUF 90 day chart

USD to HUF at 342.8 is 2.6% below its 3-month average of 352, having traded in a relatively stable 8.0% range from 338.2 to 365.1
USD to HUF
345.30
-0.1%

US dollar to Indonesian rupiah
USDIDR 90 day chart

USD to IDR at 16268 is just 0.9% below its 3-month average of 16424, having traded in a quite stable 4.4% range from 16159 to 16864
USD to IDR
16,272
+0.2%

US dollar to Israeli new sheqel
USDILS 90 day chart

USD to ILS is at 7-day highs near 3.3584, 4.5% below its 3-month average of 3.5167, having traded in a quite volatile 11.8% range from 3.3170 to 3.7085
USD to ILS
3.3669
+0.7%

US dollar to Indian rupee
USDINR 90 day chart

USD to INR is at 14-day highs near 85.98, just above its 3-month average, having traded in a very stable 3.0% range from 84.22 to 86.72
USD to INR
85.99
+0.2%
14d-highs

US dollar to Japanese yen
USDJPY 90 day chart

USD to JPY is at 60-day highs near 147.8, 2.2% above its 3-month average of 144.6, having traded in a quite stable 5.4% range from 140.9 to 148.5
USD to JPY
148.87
+0.4%
60d-highs

US dollar to South Korean won
USDKRW 90 day chart

USD to KRW at 1382 is just below its 3-month average, having traded in a relatively stable 6.3% range from 1353 to 1438
USD to KRW
1,386.3
+0.2%

US dollar to Sri Lankan rupee
USDLKR 90 day chart

USD to LKR is at 90-day highs near 301.0, just above its 3-month average, having traded in a stable 0.9% range from 298.3 to 301.0
USD to LKR
301.28
+0.1%
90d-highs

US dollar to Mexican peso
USDMXN 90 day chart

USD to MXN is at 7-day highs near 18.75, 2.4% below its 3-month average of 19.22, having traded in a relatively stable 8.0% range from 18.61 to 20.10
USD to MXN
18.82
+0.6%

US dollar to Malaysian ringgit
USDMYR 90 day chart

USD to MYR is at 14-day highs near 4.2525, just 0.5% below its 3-month average of 4.2741, having traded in a quite stable 5.1% range from 4.1975 to 4.4125
USD to MYR
4.2425
14d-highs

US dollar to Norwegian krone
USDNOK 90 day chart

USD to NOK is at 30-day highs near 10.14, just 0.7% below its 3-month average of 10.21, having traded in a relatively stable 7.5% range from 9.90 to 10.64
USD to NOK
10.26
30d-highs

US dollar to New Zealand dollar
USDNZD 90 day chart

USD to NZD is at 14-day highs near 1.6749, near its 3-month average, having traded in a quite stable 4.2% range from 1.6396 to 1.7079
USD to NZD
1.6829
+0.5%
14d-highs

US dollar to Philippine peso
USDPHP 90 day chart

USD to PHP is at 14-day highs near 56.67, just 0.9% above its 3-month average of 56.15, having traded in a very stable 3.5% range from 55.34 to 57.28
USD to PHP
56.85
+0.3%
14d-highs

US dollar to Pakistani rupee
USDPKR 90 day chart

USD to PKR is at 7-day highs near 284.6, just 0.7% above its 3-month average of 282.5, having traded in a stable 1.7% range from 280.3 to 285.1
USD to PKR
284.65
+0.1%

US dollar to Polish zloty
USDPLN 90 day chart

USD to PLN at 3.6483 is 1.9% below its 3-month average of 3.7198, having traded in a relatively stable 8.0% range from 3.5425 to 3.8276
USD to PLN
3.6766
-0.2%

US dollar to Qatari rial
USD to QAR is at 90-day lows near 3.6398, near its 3-month average, having traded in a stable 0.5% range from 3.6398 to 3.6566
USD to QAR
3.6406
90d-lows

US dollar to Russian ruble
USDRUB 90 day chart

USD to RUB at 78.10 is 2.2% below its 3-month average of 79.88, having traded in a quite volatile 10.5% range from 75.31 to 83.20
USD to RUB
78.08
-0.2%

US dollar to Saudi riyal
USDSAR 90 day chart

USD to SAR is at 60-day lows near 3.7497, near its 3-month average, having traded in a stable 0.5% range from 3.7363 to 3.7568
USD to SAR
3.7506
60d-lows

US dollar to Solomon Islands dollar
USD to SBD is at 90-day lows near 8.3196, just below its 3-month average, having traded in a stable 0.6% range from 8.3196 to 8.3683
USD to SBD
8.3196
-0.1%
90d-lows

US dollar to Swedish krona
USDSEK 90 day chart

USD to SEK is at 14-day highs near 9.6194, near its 3-month average, having traded in a quite stable 4.5% range from 9.4470 to 9.8749
USD to SEK
9.7239
+0.4%
14d-highs

US dollar to Singapore dollar
USDSGD 90 day chart

USD to SGD is at 14-day highs near 1.2825, just 0.7% below its 3-month average of 1.2912, having traded in a very stable 3.8% range from 1.2716 to 1.3194
USD to SGD
1.2855
+0.1%
14d-highs

US dollar to Thai baht
USDTHB 90 day chart

USD to THB at 32.46 is 1.2% below its 3-month average of 32.84, having traded in a very stable 4.0% range from 32.30 to 33.59
USD to THB
32.60

US dollar to Turkish lira
USDTRY 90 day chart

USD to TRY is at 90-day highs near 40.24, 2.8% above its 3-month average of 39.13, having traded in a quite stable 5.8% range from 38.02 to 40.24
USD to TRY
40.23
+0.2%
90d-highs

US dollar to New Taiwan dollar
USDTWD 90 day chart

USD to TWD at 29.36 is 2.9% below its 3-month average of 30.23, having traded in a rather volatile 12.7% range from 28.93 to 32.59
USD to TWD
29.40
+0.4%

US dollar to Ukrainian hryvnia
USD to UAH at 41.82 is just 0.5% above its 3-month average of 41.6, having traded in a stable 1.6% range from 41.22 to 41.88
USD to UAH
41.85
+0.1%

US dollar to Vietnamese dong
USDVND 90 day chart

USD to VND is at 14-day lows near 26114, just above its 3-month average, having traded in a stable 1.5% range from 25822 to 26212
USD to VND
26,137
14d-lows

US dollar to Samoan tala
USD to WST is steady at its 3-month average 2.8.
USD to WST
2.8000

US dollar to Central African franc
USDXAF 90 day chart

USD to XAF is at 14-day highs near 562.3, 1.9% below its 3-month average of 572.9, having traded in a relatively stable 6.5% range from 555.6 to 591.6
USD to XAF
565.36
14d-highs

US dollar to West African franc
USDXOF 90 day chart

USD to XOF is at 14-day highs near 562.3, 1.9% below its 3-month average of 572.9, having traded in a relatively stable 6.5% range from 555.6 to 591.6
USD to XOF
565.36
14d-highs

US dollar to CFP franc
USD to XPF is at 14-day highs near 102.3, 1.8% below its 3-month average of 104.2, having traded in a relatively stable 6.4% range from 101.1 to 107.6
USD to XPF
102.85
14d-highs

US dollar to South African rand
USDZAR 90 day chart

USD to ZAR at 17.91 is just 0.9% below its 3-month average of 18.08, having traded in a fairly volatile 8.6% range from 17.52 to 19.03
USD to ZAR
17.93
-0.1%