You Can Save Money when you Compare ABN AMRO Exchange Rate Margins & Fees
The above comparison table makes it easy to calculate the Total Cost you are being charged on your currency transaction by ![]() ABN AMRO versus the below market mid-rate. It is easy to calculate any savings available from popular market-leading FX providers.
ABN AMRO versus the below market mid-rate. It is easy to calculate any savings available from popular market-leading FX providers.
Sell EUR →
Buy EUR
1 EUR = 1.0000 EUR
--
Tracker
1 EUR =
1.0000 EUR
Is Euro (EUR) expected to go up or down?
This is always a difficult question as exchange rates are influenced by many factors, so a good method to consider the Euro current value is to look the EUR performance against a range of other currencies over various time periods.
The following table looks at the performance of the EUR exchange rate against selections of other currencies over time periods from the previous 2 days back to the last 5 years.
Popular Rates (A - Z)
United Arab Emirates dirham to Indian rupee

AED to INR at 23.24 is just 0.5% below its 3-month average of 23.36, having traded in a very stable 3.9% range from 22.93 to 23.82
AED to INR
23.29
—
Australian dollar to Chinese yuan

AUD to CNY at 4.6317 is just 0.7% above its 3-month average of 4.6013, having traded in a fairly volatile 8.4% range from 4.3713 to 4.7378
AUD to CNY
4.6330
▲+0.2%
Australian dollar to Euro

AUD to EUR is at 14-day lows near 0.5664, just 0.9% below its 3-month average of 0.5718, having traded in a fairly volatile 10.0% range from 0.5436 to 0.5982
AUD to EUR
0.5664
▼-0.5%
14d-lows
Australian dollar to British pound

AUD to GBP at 0.4774 is 1.2% below its 3-month average of 0.483, having traded in a quite stable 5.8% range from 0.4666 to 0.4937
AUD to GBP
0.4776
▲+0.1%
14d-lows
Australian dollar to Japanese yen

AUD to JPY at 92.64 is near its 3-month average, having traded in a fairly volatile 9.5% range from 87.14 to 95.43
AUD to JPY
92.59
▼-0.5%
Australian dollar to New Zealand dollar

AUD to NZD at 1.0781 is just 0.9% below its 3-month average of 1.088, having traded in a very stable 4.0% range from 1.0671 to 1.1096
AUD to NZD
1.0773
▲+0.1%
Australian dollar to US dollar

AUD to USD at 0.6446 is 1.7% above its 3-month average of 0.6341, having traded in a fairly volatile 9.0% range from 0.5957 to 0.6496
AUD to USD
0.6435
▲+0.3%
Bitcoin to US dollar
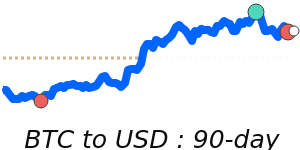
BTC to USD at 105849 is 15.4% above its 3-month average of 91710, having traded in a highly volatile 44.3% range from 77000 to 111098
BTC to USD
103,966
▼-1.4%
Canadian dollar to Australian dollar

CAD to AUD at 1.1238 is just above its 3-month average, having traded in a relatively stable 7.4% range from 1.0963 to 1.1770
CAD to AUD
1.1305
▼-0.1%
Etherium to US dollar
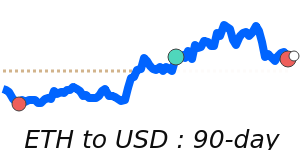
ETH to USD at 2639 is 29.9% above its 3-month average of 2032, having traded in a highly volatile 81.9% range from 1479 to 2690
ETH to USD
2,546.9
▲+0.2%
Euro to Canadian dollar

EUR to CAD is at 14-day highs near 1.5708, just 0.6% above its 3-month average of 1.5606, having traded in a relatively stable 6.2% range from 1.5006 to 1.5937
EUR to CAD
1.5616
▲+0.5%
14d-highs
Euro to British pound

EUR to GBP is at 7-day highs near 0.8428, just below its 3-month average, having traded in a quite stable 5.3% range from 0.8246 to 0.8683
EUR to GBP
0.8432
▲+0.5%
Euro to Japanese yen

EUR to JPY at 163.5 is just 0.9% above its 3-month average of 162, having traded in a quite stable 5.6% range from 156.2 to 165.0
EUR to JPY
163.45
▼-0.1%
Euro to US dollar

EUR to USD at 1.1378 is 2.6% above its 3-month average of 1.1094, having traded in a quite volatile 11.0% range from 1.0375 to 1.1513
EUR to USD
1.1360
▲+0.8%
British pound to US dollar

GBP to USD at 1.3501 is 2.8% above its 3-month average of 1.313, having traded in a relatively stable 7.9% range from 1.2573 to 1.3563
GBP to USD
1.3472
▲+0.2%
British pound to US dollar
GBP to USD at 1.3501 is 2.8% above its 3-month average of 1.313, having traded in a relatively stable 7.9% range from 1.2573 to 1.3563
GBP to USD
1.3472
▲+0.2%
Hong Kong dollar to Japanese yen

HKD to JPY at 18.33 is 2.4% below its 3-month average of 18.78, having traded in a relatively stable 7.0% range from 18.15 to 19.42
HKD to JPY
18.35
▼-0.8%
New Zealand dollar to British pound

NZD to GBP is at 7-day highs near 0.4430, just below its 3-month average, having traded in a very stable 3.9% range from 0.4335 to 0.4503
NZD to GBP
0.4434
—
New Zealand dollar to US dollar

NZD to USD at 0.5978 is 2.6% above its 3-month average of 0.5829, having traded in a fairly volatile 8.5% range from 0.5534 to 0.6007
NZD to USD
0.5973
▲+0.2%
Brent Crude Oil to US dollar
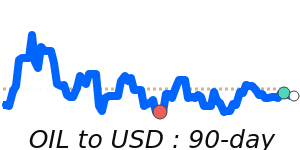
OIL to USD is at 14-day lows near 64.13, 4.9% below its 3-month average of 67.43, having traded in a very volatile 24.7% range from 60.14 to 75.02
OIL to USD
63.84
▼-0.7%
14d-lows
US dollar to Canadian dollar

USD to CAD at 1.3806 is 1.9% below its 3-month average of 1.4072, having traded in a quite stable 5.8% range from 1.3718 to 1.4509
USD to CAD
1.3746
▼-0.2%
US dollar to Swiss franc

USD to CHF at 0.8220 is 3.3% below its 3-month average of 0.8498, having traded in a quite volatile 11.6% range from 0.8092 to 0.9034
USD to CHF
0.8219
▼-0.6%
US dollar to Chinese yuan

USD to CNY at 7.1859 is just 1.0% below its 3-month average of 7.2567, having traded in a very stable 2.4% range from 7.1806 to 7.3499
USD to CNY
7.1998
▼-0.1%
US dollar to Hong Kong dollar

USD to HKD is at 90-day highs near 7.8417, just 0.8% above its 3-month average of 7.78, having traded in a stable 1.2% range from 7.7500 to 7.8417
USD to HKD
7.8408
—
90d-highs
US dollar to Japanese yen

USD to JPY at 143.7 is 1.6% below its 3-month average of 146.1, having traded in a relatively stable 7.2% range from 140.9 to 151.0
USD to JPY
143.88
▼-0.8%
US dollar to Mexican peso

USD to MXN at 19.31 is 3.0% below its 3-month average of 19.9, having traded in a fairly volatile 8.4% range from 19.24 to 20.85
USD to MXN
19.39
▼-0.4%
US dollar to Philippine peso

USD to PHP at 55.61 is 1.8% below its 3-month average of 56.63, having traded in a quite stable 4.8% range from 55.34 to 57.99
USD to PHP
55.79
▲+0.1%
US dollar to Singapore dollar

USD to SGD at 1.2863 is 2.4% below its 3-month average of 1.3185, having traded in a quite stable 5.4% range from 1.2842 to 1.3535
USD to SGD
1.2896
▼-0.2%
View a full list of exchange rates by selecting your Base (from) currency: