AED Market Update
18 Jul 2026 • 01:17 GMT
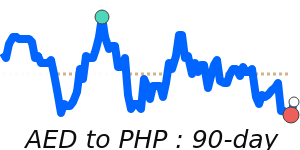
The UAE Dirham (AED) remains stable against the US dollar, holding steady at its 3-month average of approximately 0.2723. Despite strong support for the dollar driven by rising energy prices and geopolitical tensions in the Middle East, the AED has maintained its position, reflecting its resilience in current market conditions.
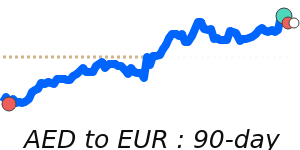
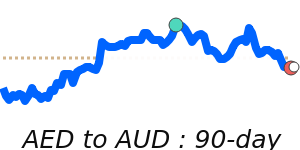
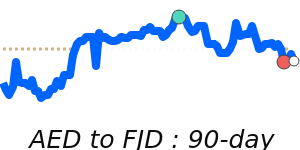
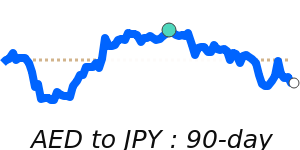
Against other major currencies, the AED has seen slight gains. It has strengthened slightly against the euro, trading at about 0.2380, above its recent averages. Similarly, the AED has edged higher versus the Japanese yen, reaching near 44.24, its highest in the past week, and against the Australian dollar, trading around 0.3900. The currency has also advanced against the Indian rupee, hitting 26.32, near a 30-day high.
While broader USD fluctuations continue amid global and regional developments, the AED’s stability indicates confidence in the UAE’s economic outlook. Market watchers will continue to monitor energy prices, geopolitical risks, and upcoming US economic data, which could influence the dollar and, consequently, the AED’s position. But for now, the dirham remains steady in a relatively calm trading environment.