CAD Market Update
16 Jul 2026 • 00:30 GMT
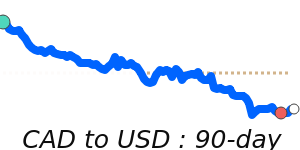
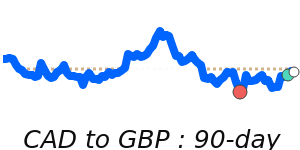
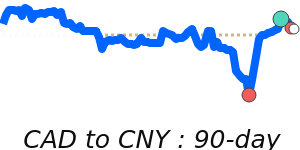
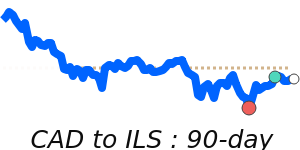
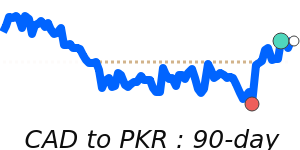
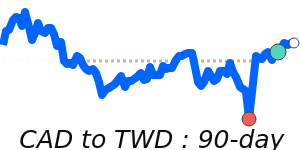
The Canadian dollar is trading near two-week highs against the US dollar at around 0.7123, though below its three-month average of 0.7195. This stability follows the Bank of Canada's decision to keep interest rates steady at 2.25%, signaling confidence in the domestic economy after recent strong employment data. Despite this, the loonie remains within a broad 4.8% trading range from 0.7026 to 0.7363, indicating cautious movements ahead.
On the USD front, the dollar remains supported by geopolitical concerns and rising oil prices but has been experiencing some volatility due to mixed economic data. The market continues to watch upcoming US inflation figures and labor market reports closely, which could influence Fed rate expectations.
Looking ahead, the CAD's near-term outlook will depend on domestic economic indicators, especially inflation and employment figures, and global trade tensions, notably USMCA negotiations. While major banks suggest the USD/CAD may weaken slightly by year's end, ranging around 1.34 to 1.36, some analysts see potential for a small increase if external factors shift. Overall, the loonie remains steady, with limited directional moves in the immediate future.
📊 Quick forecast view
🔴 Mild downside
0.7230 – 1.3400
🌍 Global risk sentiment
⚪ Range-bound