
Latest market analysis
CAD Market Update
29 Jul 2026 • 00:27 GMT
The Canadian dollar (CAD) is slightly weaker against the US dollar, trading around 0.7088. This is about 1.1% below its three-month average of 0.7166, indicating a modest pullback. The move comes amid weaker oil prices, which have dipped to roughly US$79.40 per barrel. Since Canada relies heavily on energy exports, lower oil prices tend to weigh on the CAD.
Despite the slight decline, the CAD remains within a stable trading range, with little recent volatility. Market focus is now on oil price trends and US-Dollar strength, as these factors could influence the CAD’s next move. The US dollar remains supported by stable growth and inflation concerns, and energy markets are closely watched for any signs of further declines or rebounds.
Overall, the Canadian dollar continues to trade close to its fair value, and traders are watching for changes in oil or US economic conditions that could impact its outlook. For now, the currency remains fairly steady, with limited immediate directional moves.
Forecast snapshot
Quick CAD/USD forecast
Near-term bias⚪ Range-bound
Expected range0.7060 – 0.7270
Dominant driver⚖️ Interest-rate differentials
3-month trend🔴 Downtrend
Stay informed
CAD news & insights
Recent analysis, guides and market developments relevant to the Canadian dollar.


Rate direction
Canadian dollar to US dollar · CAD/USD trend
Review the recent market direction, current mid-market rate and significant movement alerts.
Compare before you exchange
Compare and save on CAD exchange rates
Exchange rates vary between banks and currency providers. Use the comparison below to understand total costs and potential savings against typical bank pricing.
Loading exchange rates...
|
|
|
||
|
|
|
||
|
|
|
||
|
|
|
Explore CAD pairs
Popular CAD exchange rates
Open a currency pair to view its live rate, comparison options, recent trend and market context.
1 CAD =0.7098USD
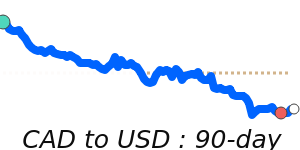
1D+0.1%▲
1 CAD =0.6237EUR
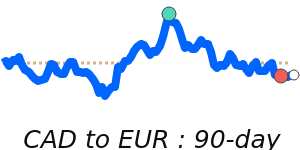
1D0.0%⬦
1 CAD =12.44MXN
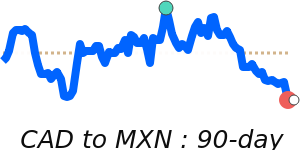
1D0.0%⬦
1 USD =0.8787EUR

1D−0.2%▼
1 CAD =68.00INR
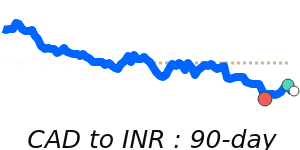
1D−0.1%▼
1 CAD =0.5343GBP
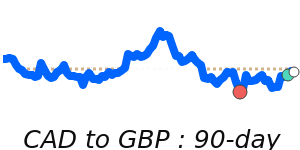
1D+0.2%▲
1 CAD =43.62PHP
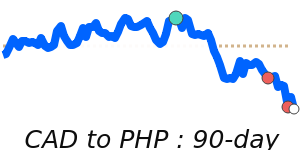
1D−0.2%▼
1 CAD =1.0246AUD

1D+0.4%▲
1 INR =0.014705CAD
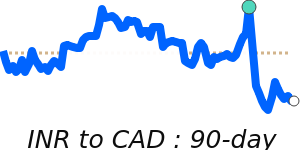
1D+0.1%▲