
Latest market analysis
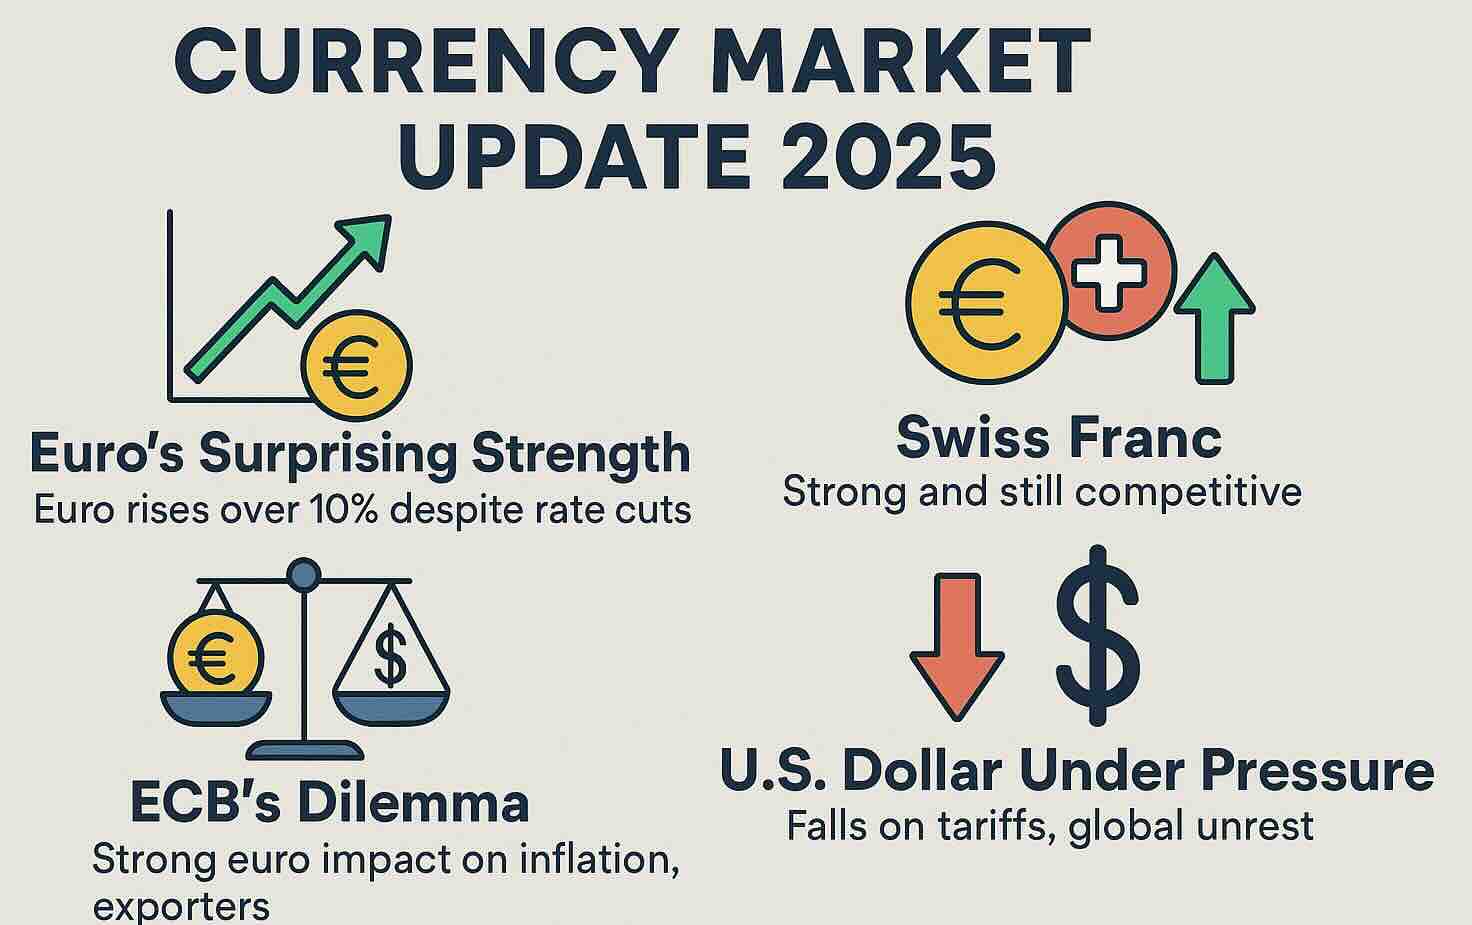
CHF Market Update
01 Aug 2026 • 01:06 GMT
The Swiss franc remains relatively strong against the US dollar, trading at around 1.238, which is slightly below its three-month average of 1.253. The currency has traded within a stable range from 1.2205 to 1.2880 over the past few months. Recent market pressure from the US dollar has increased due to expectations of a hawkish Fed, supported by rising energy prices and strong US economic data. However, the Swiss National Bank continues to afford the franc safe-haven status, and its willingness to intervene if the currency appreciates too quickly keeps the outlook balanced.
While the USD has regained some footing heading into the upcoming FOMC meeting, the Swiss franc's strength amid global uncertainties keeps it supported. Analysts suggest the franc may stay firm, especially if geopolitical tensions rise or risk aversion increases. The Swiss economy's resilience, along with the Bank’s cautious stance, suggests the currency will continue to hold its ground. Traders should watch US economic indicators and Fed signals for further clues, as these could influence US dollar movements and, consequently, the franc’s short-term trend.
Forecast snapshot
Quick CHF/USD forecast
Near-term bias🔴 Mild downside
Expected range1.1990 – 1.2380
Dominant driver🏦 Central bank policy divergence
3-month trend🔴 Downtrend
Stay informed
CHF news & insights
Recent analysis, guides and market developments relevant to the Swiss franc.


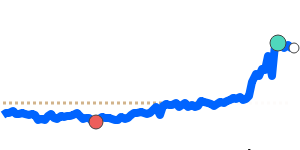
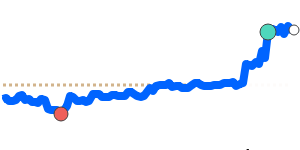
Rate direction
Swiss franc to US dollar · CHF/USD trend
Review the recent market direction, current mid-market rate and significant movement alerts.
Compare before you exchange
Compare and save on CHF exchange rates
Exchange rates vary between banks and currency providers. Use the comparison below to understand total costs and potential savings against typical bank pricing.
Loading exchange rates...
|
|
|
||
|
|
|
||
|
|
|
||
|
|
|
Explore CHF pairs
Popular CHF exchange rates
Open a currency pair to view its live rate, comparison options, recent trend and market context.
1 CHF =1.2405USD

1D−0.4%▼
1 CHF =1.0738EUR
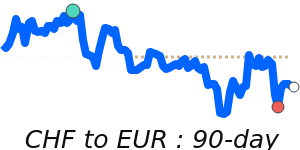
1D−0.4%▼
1 CHF =1.7377CAD
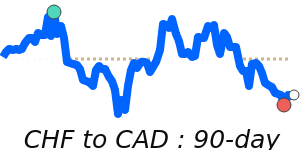
1D−0.2%▼
1 CHF =0.9193GBP
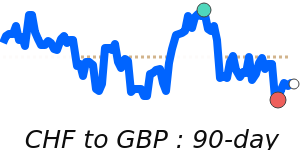
1D−0.5%▼
1 CHF =118.34INR
1D−0.5%▼
1 CHF =194.82JPY
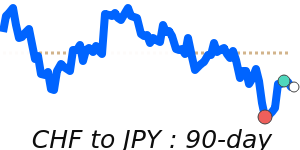
1D−1.6%▼
90dLows
1 CHF =1.7592AUD
1D−0.1%▼
1 CHF =1.5910SGD
1D−0.1%▼
1 CHF =8.3750CNY
1D−0.4%▼