ILS Market Update
25 Jul 2026 • 01:21 GMT
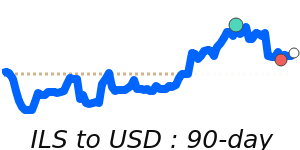
The Israeli shekel remains somewhat weaker against the US dollar, with the USD/ILS rate at around 3.30, about 3.2% below its three-month average. The shekel has seen some volatility lately, trading in a range from 3.25 to 3.57, influenced by regional and domestic factors.
Recently, the Bank of Israel unexpectedly cut interest rates by 0.25%, citing improved inflation and a stronger shekel. This move supports the local currency’s resilience, which appreciated roughly 3.5% against the dollar last quarter amid signs of solid economic growth and regional stability. Meanwhile, broader USD strength driven by geopolitical tensions and oil price increases has kept the dollar relatively firm.
Despite the recent rate cut, the shekel’s strength over the past months reflects positive economic fundamentals and regional developments, such as improved relations with neighboring countries. However, ongoing geopolitical risks could lead to short-term volatility.
Overall, expect the shekel to remain relatively stable but watch for any sudden shifts if regional tensions or global economic changes influence investor sentiment.