
Latest market analysis
JPY Market Update
31 Jul 2026 • 00:27 GMT
The Japanese yen has recently traded around 163 against the dollar, reaching levels not seen since 1986. The move reflects ongoing pressure from higher interest rate differentials and rising oil prices, which support the dollar and the carry trade. While the Bank of Japan has yet to make any major changes, some traders wondered if a rate hike might come sooner, but no action has been taken.
The yen's decline has been driven mainly by external factors such as geopolitical tensions and higher energy costs, which bolster the US dollar. Despite some speculation that Japanese authorities might intervene to boost the yen, no significant shifts have occurred yet. Market participants continue to monitor postures from Japan’s financial officials and U.S. interest rate trends, which could influence the yen’s future direction.
Overall, the USD/JPY pair remains within a range close to the 3-month average. Many banks anticipate the yen could weaken further by year-end, with some forecasting a move towards 160 or higher if current trends persist. However, any surprise intervention from Japan could cause sharp reversals, so traders remain watchful of upcoming policy signals and geopolitical developments.
Forecast snapshot
Quick USD/JPY forecast
Near-term bias🔴 Mild downside
Expected range160.2000 – 163.9000
Dominant driver🌍 Global risk sentiment
3-month trend🔴 Downtrend
Stay informed
JPY news & insights
Recent analysis, guides and market developments relevant to the Japanese yen.


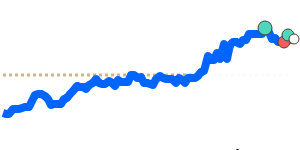
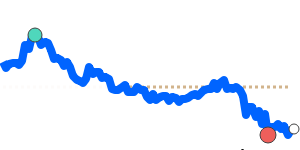
Rate direction
US dollar to Japanese yen · USD/JPY trend
Review the recent market direction, current mid-market rate and significant movement alerts.
Compare before you exchange
Compare and save on JPY exchange rates
Exchange rates vary between banks and currency providers. Use the comparison below to understand total costs and potential savings against typical bank pricing.
Loading exchange rates...
|
|
|
||
|
|
|
||
|
|
|
||
|
|
|
Explore JPY pairs
Popular JPY exchange rates
Open a currency pair to view its live rate, comparison options, recent trend and market context.
1 JPY =0.006328USD
1D+2.0%▲
1 USD =158.04JPY

1D−2.0%▼
1 JPY =0.008869CAD
1D+1.8%▲
1 JPY =0.005484EUR
1D+1.5%▲
1 JPY =0.004692GBP
1D+1.3%▲
1 AED =43.03JPY
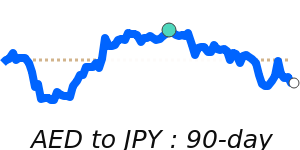
1D−2.0%▼
1 JPY =114.09IDR
1D+1.9%▲
1 MYR =38.69JPY
1D−1.8%▼
1 AUD =111.26JPY

1D−1.1%▼