Latest market analysis
MXN Market Update
01 Aug 2026 • 01:10 GMT
The Mexican peso has recently reached its 30-day high against the US dollar, trading near 0.057668, slightly above its three-month average. Despite this recent strength, the peso remains within a stable trading range. The US dollar has been regaining strength ahead of the upcoming Federal Reserve meeting, as markets prepare for potential rate hikes.
This US dollar rally has limited the peso’s gains so far, with the currency consolidating near recent highs. While Banxico’s decision to hold rates steady continues to support the peso through attractive carry-trades, market sentiment could shift depending on the Fed’s signals. Traders should watch for any indications of monetary policy tightening from the Federal Reserve, which could strengthen the US dollar further and pressure the peso.
Overall, the peso's stability reflects cautious optimism, but ongoing US monetary policy developments remain key to its short-term direction. Be mindful of external economic factors, including geopolitical tensions and trade negotiations, that could introduce volatility.
Forecast snapshot
Quick MXN/USD forecast
Near-term bias⚪ Range-bound
Expected range0.0570 – 0.0580
Dominant driver⚖️ Interest-rate differentials
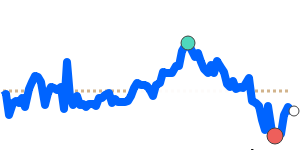
3-month trend🔴 Downtrend
Stay informed
MXN news & insights
Recent analysis, guides and market developments relevant to the Mexican peso.


Rate direction
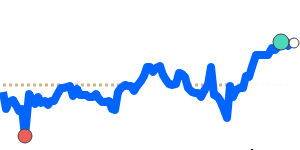
US dollar to Mexican peso · USD/MXN trend
Review the recent market direction, current mid-market rate and significant movement alerts.
Compare before you exchange
Compare and save on MXN exchange rates
Exchange rates vary between banks and currency providers. Use the comparison below to understand total costs and potential savings against typical bank pricing.
Loading exchange rates...
|
|
|
||
|
|
|
||
|
|
|
||
|
|
|
Explore MXN pairs
Popular MXN exchange rates
Open a currency pair to view its live rate, comparison options, recent trend and market context.
1 MXN =0.057645USD
1D0.0%⬦
1 MXN =0.049968EUR
1D−0.1%▼
1 MXN =0.080885CAD
1D+0.1%▲
1 MXN =0.042756GBP
1D−0.1%▼
1 MXN =5.4995INR
1D−0.2%▼
1 MXN =9.0754JPY
1D−1.3%▼
1 MXN =0.082186AUD
1D+0.2%▲
1 MXN =0.074011SGD
1D+0.2%▲
1 MXN =0.3892CNY
1D−0.1%▼