MYR Market Update
20 Jul 2026 • 00:33 GMT
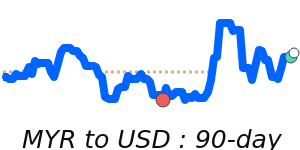
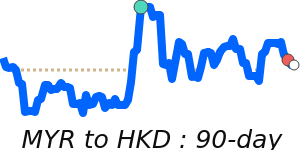
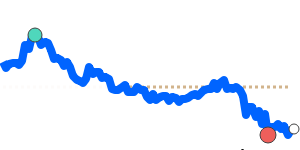
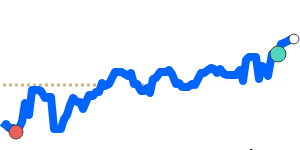
The Malaysian Ringgit (MYR) has traded near 14-day lows against the US dollar at around 0.2441, about 1.8% below its 3-month average of 0.2488. Despite this, the MYR remains within a stable range, reflecting Malaysia’s resilient economic fundamentals. Recent positive news, including steady economic growth and supportive fiscal policies, continues to underpin the currency’s outlook.
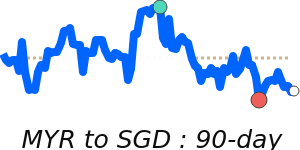
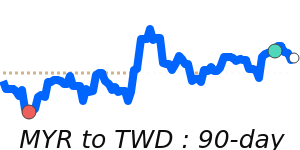
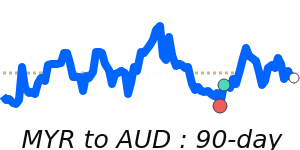
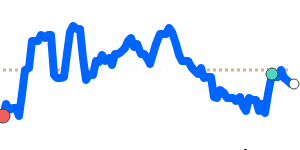
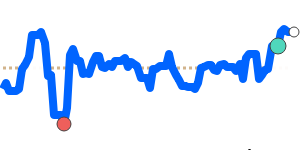
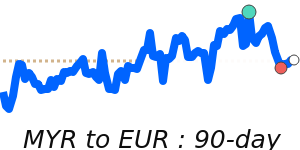
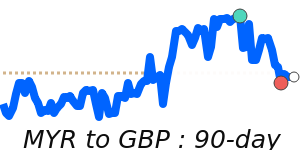
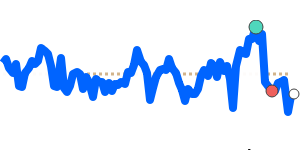
Against the euro, the MYR is also holding close to its average levels, helping maintain a steady position in recent trading. The currency’s stability against other major currencies like the GBP, JPY, and AUD further highlights the overall market confidence in Malaysia’s economic prospects.
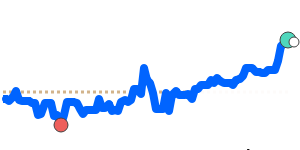
Looking ahead, while U.S. dollar strength persists due to high inflation and geopolitical factors, analysts generally expect the MYR to gradually strengthen through the year, supported by Malaysia’s steady economic growth and foreign investment inflows. Most forecasts suggest the MYR could see further gains against the USD if U.S. monetary policy shows signs of easing.
Keep monitoring global US dollar trends and local economic developments for the latest updates.
📊 Quick forecast view
🔴 Mild downside
0.2370 – 0.2440
🌍 Global risk sentiment
🟢 Uptrend