
Latest market analysis
NOK Market Update
03 Aug 2026 • 00:29 GMT
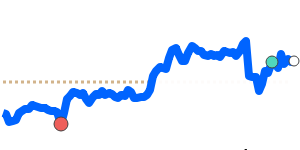
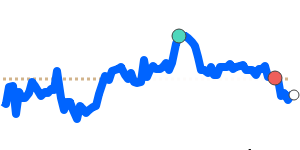
The Norwegian krone (NOK) remains relatively stable against the US dollar, trading around 0.1054, just above its three-month average. The recent volatility in NOK/USD has been notable, trading within an 8.2% range from 0.1007 to 0.1090, reflecting cautious market sentiment as traders monitor US dollar strength. The dollar has regained momentum ahead of key US economic data and the upcoming Federal Reserve meeting, which is expected to signal further monetary policy firmness.
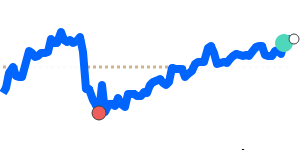
Meanwhile, the NOK has shown resilience against the euro and other major currencies. It is slightly above its three-month average against the euro at 0.0913, with the EUR/NOK pairing trading within a stable 5.6% range, indicating limited recent movement. The NOK's performance against the yen is somewhat softer, trading at 16.61—about 1.4% below its 3-month average—reflecting differing regional economic developments. Overall, the NOK remains quietly supported as markets weigh the US dollar’s recent strength and possible further rate hikes by Norges Bank later this year.
Forecast snapshot
Quick NOK/USD forecast
Near-term bias🟢 Mild upside
Expected range0.1060 – 0.1110
Dominant driver🌍 Global risk sentiment
3-month trend🟢 Uptrend
Stay informed
NOK news & insights
Recent analysis, guides and market developments relevant to the Norwegian krone.


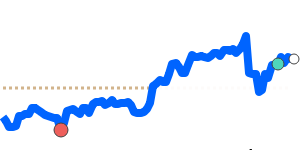
Rate direction
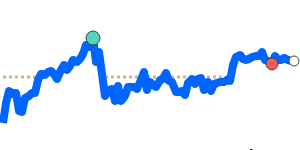
US dollar to Norwegian krone · USD/NOK trend
Review the recent market direction, current mid-market rate and significant movement alerts.
Compare before you exchange
Compare and save on NOK exchange rates
Exchange rates vary between banks and currency providers. Use the comparison below to understand total costs and potential savings against typical bank pricing.
Loading exchange rates...
|
|
|
||
|
|
|
||
|
|
|
||
|
|
|
Explore NOK pairs
Popular NOK exchange rates
Open a currency pair to view its live rate, comparison options, recent trend and market context.
1 NOK =0.1047USD
1D−0.2%▼
1 NOK =0.090988EUR
1D−0.2%▼
1 NOK =0.1471CAD
1D−0.3%▼
1 NOK =0.077998GBP
1D−0.2%▼
1 NOK =9.9759INR
1D−0.1%▼
1 NOK =16.43JPY
1D−0.1%▼
1 NOK =0.1497AUD
1D−0.6%▼
1 NOK =0.1343SGD
1D−0.4%▼
1 NOK =0.7069CNY
1D−0.2%▼