THB Market Update
24 Jul 2026 • 00:32 GMT
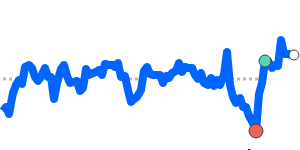
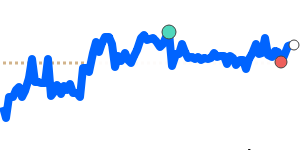
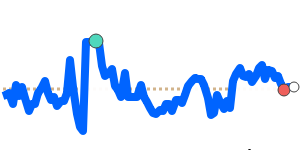
The Thai baht has recently moved to its 90-day lows against the US dollar, trading near 0.02955, which is around 2.7% weaker than its three-month average. This decline reflects ongoing external pressures, including a strong US dollar driven by safe-haven demand amid geopolitical tensions and concerns over energy prices.
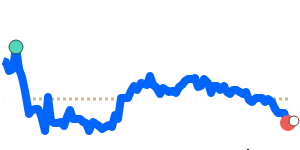
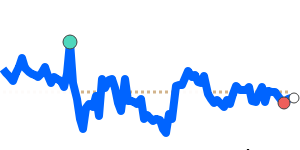
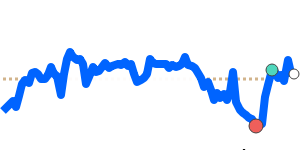
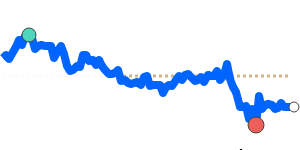
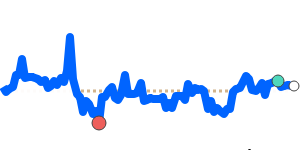
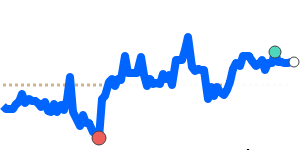
Meanwhile, the baht remains stable against the euro and the Japanese yen, with small declines of around 1.2% and 0.5%, respectively. The currency has also strengthened slightly against the Swiss franc and the Australian dollar in recent days, but remains near the lower end of its recent trading range.
Factors influencing the baht include Thailand's recent rate cuts and measures to manage gold transactions aimed at stabilizing the currency. Additionally, global factors such as US monetary policy expectations and energy costs continue to impact the Thai currency outlook.
Overall, the baht faces some downward pressure but remains within expected trading ranges, with external geopolitical and economic developments likely to be key in determining its near-term trajectory.