Switch .com Best Exchange Rates .com Best Exchange Rates .com Best Exchange Rates
BER

Pacific - Key Exchange Rates

Latest mid-market exchange rates with 90-day UP/DOWN trends and HIGH/LOW alerts for the most popular Pacific cross rates. Keep track of when currency rates are in your favour.

Discover the latest exchange rates for key Pacific currencies, including the Australian Dollar (AUD), New Zealand Dollar (NZD), Fijian Dollar (FJD), and more. Whether you're managing international business, planning travel across the Pacific region, or keeping an eye on currency trends, our up-to-date information ensures you stay ahead. Explore competitive rates and insights to make smarter decisions for your foreign exchange needs in the dynamic Pacific market.

Pacific


Australian dollar to Fijian dollar
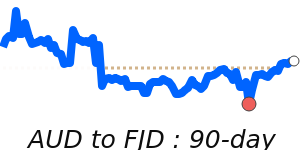
AUDFJD 90 day chart

AUD to FJD is at 7-day lows near 1.4607, just 0.6% above its 3-month average of 1.4516, having traded in a relatively stable 7.3% range from 1.3905 to 1.4914
AUD to FJD
1.4599

Australian dollar to New Zealand dollar
AUDNZD 90 day chart

AUD to NZD is at 30-day lows near 1.0761, just 0.7% below its 3-month average of 1.0839, having traded in a very stable 3.3% range from 1.0671 to 1.1022
AUD to NZD
1.0788
-0.2%
30d-lows

Australian dollar to Solomon Islands dollar
AUD to SBD at 5.4431 is 2.2% above its 3-month average of 5.3251, having traded in a fairly volatile 10.0% range from 4.9540 to 5.4512
AUD to SBD
5.4242
+0.3%
90d-highs

Australian dollar to US dollar
AUDUSD 90 day chart

AUD to USD at 0.6524 is 2.4% above its 3-month average of 0.6374, having traded in a fairly volatile 9.7% range from 0.5957 to 0.6533
AUD to USD
0.6498
+0.4%
90d-highs

Australian dollar to CFP franc
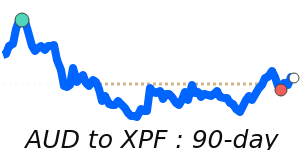
AUDXPF 90 day chart

AUD to XPF is at 30-day lows near 67.07, 1.2% below its 3-month average of 67.89, having traded in a relatively stable 7.7% range from 64.87 to 69.89
AUD to XPF
67.21
-0.7%
30d-lows

New Zealand dollar to Australian dollar
NZDAUD 90 day chart

NZD to AUD is at 30-day highs near 0.9293, just 0.7% above its 3-month average of 0.9227, having traded in a very stable 3.3% range from 0.9072 to 0.9371
NZD to AUD
0.9270
+0.2%
30d-highs

New Zealand dollar to Fijian dollar
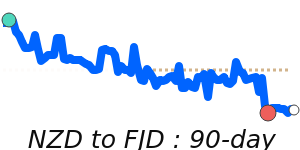
NZDFJD 90 day chart

NZD to FJD at 1.3574 is 1.3% above its 3-month average of 1.3394, having traded in a relatively stable 6.5% range from 1.2899 to 1.3742
NZD to FJD
1.3533
+0.2%
14d-highs

US dollar to Australian dollar
USDAUD 90 day chart

USD to AUD at 1.5326 is 2.3% below its 3-month average of 1.5693, having traded in a fairly volatile 9.7% range from 1.5306 to 1.6787
USD to AUD
1.5389
-0.4%

US dollar to Fijian dollar
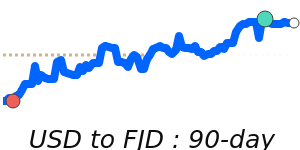
USDFJD 90 day chart

USD to FJD is at 90-day lows near 2.2392, 1.7% below its 3-month average of 2.2776, having traded in a quite stable 4.8% range from 2.2392 to 2.3464
USD to FJD
2.2468
-0.4%
90d-lows

US dollar to Papua New Guinean kina
USD to PGK is at 7-day highs near 4.1573, 1.3% above its 3-month average of 4.1033, having traded in a very stable 3.4% range from 4.0305 to 4.1670
USD to PGK
4.1808
+0.9%

US dollar to Solomon Islands dollar
USD to SBD is at 14-day lows near 8.3404, near its 3-month average, having traded in a stable 1.3% range from 8.3163 to 8.4220
USD to SBD
8.3474
14d-lows

US dollar to Tongan paanga
USD to TOP is steady at its 3-month average 2.4078.
USD to TOP
2.4078

US dollar to Vanuatu vatu
USD to VUV is steady at its 3-month average 118.7.
USD to VUV
118.72

US dollar to Samoan tala
USD to WST is steady at its 3-month average 2.8.
USD to WST
2.8000

US dollar to CFP franc
USD to XPF is at 90-day lows near 102.8, 3.5% below its 3-month average of 106.5, having traded in a relatively stable 8.0% range from 102.8 to 111.0
USD to XPF
103.43
-1.1%
90d-lows

View a full list of exchange rates by selecting your Base (from) currency: