
Latest market analysis
AUD Market Update
01 Aug 2026 • 01:06 GMT
The Australian dollar (AUD) is currently hovering near its recent levels against the US dollar, trading at about 0.7014, just below its 3-month average of 0.7053. The AUD has been relatively stable within a 5.4% range from 0.6887 to 0.7258. Recently, the AUD tested the key 0.7000 level, supported by solid commodity prices and interest rate differentials. However, the dollar's recent strength as the US prepares for the Federal Reserve’s upcoming rate decision has kept a lid on gains.
The US dollar has regained some momentum ahead of the FOMC meeting, approaching its year-to-date highs, which puts pressure on the AUD. Any hints from the Fed about future rate hikes could influence USD direction, impacting the AUD/USD pair. Meanwhile, the Reserve Bank of Australia’s upcoming economic data, particularly inflation figures, will be crucial for setting expectations around monetary policy.
In other currency pairs, the AUD remains near stable levels against the euro and Canadian dollar but has drifted slightly lower against the yen and British pound, both near multi-week lows. Overall, traders should watch for US dollar movements and upcoming Australian data, as these will likely be the key drivers for the AUD in the coming days.
Forecast snapshot
Quick AUD/USD forecast
Near-term bias🔴 Mild downside
Expected range0.7010 – 0.7260
Dominant driver🌍 Global risk sentiment
3-month trend🟢 Uptrend
Stay informed
AUD news & insights
Recent analysis, guides and market developments relevant to the Australian dollar.


Rate direction
Australian dollar to US dollar · AUD/USD trend
Review the recent market direction, current mid-market rate and significant movement alerts.
Compare before you exchange
Compare and save on AUD exchange rates
Exchange rates vary between banks and currency providers. Use the comparison below to understand total costs and potential savings against typical bank pricing.
Loading exchange rates...
|
|
|
||
|
|
|
||
|
|
|
||
|
|
|
Explore AUD pairs
Popular AUD exchange rates
Open a currency pair to view its live rate, comparison options, recent trend and market context.
1 AUD =0.6992USD

1D−0.2%▼
1 AUD =0.6063EUR

1D−0.3%▼
1 AUD =110.07JPY

1D−1.5%▼
90dLows
1 AUD =1.1897NZD

1D−0.2%▼
90dLows
1 AUD =66.71INR
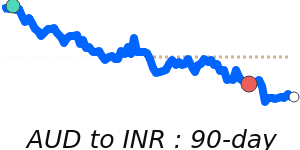
1D−0.3%▼
1 AUD =12,606IDR
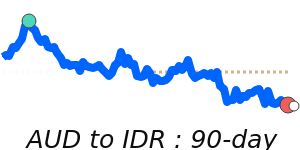
1D−0.3%▼
1 AUD =0.8977SGD
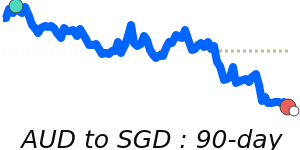
1D0.0%⬦
1 AUD =2.8564MYR
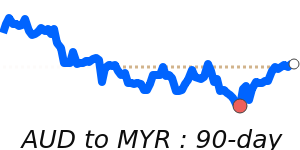
1D−0.3%▼