CHF Market Update
23 Jul 2026 • 00:28 GMT
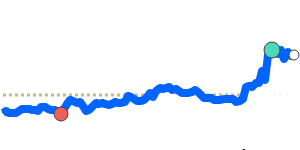
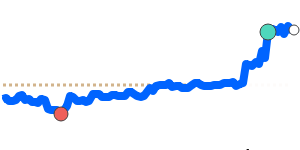
The Swiss franc has recently weakened slightly against the US dollar, with the USD/CHF rate hovering near 0.8120, a bit above its 7-day low of around 0.8080. This small shift comes as the dollar is supported by ongoing safe-haven flows amid global tensions. Despite this, the franc remains relatively strong overall, supported by Switzerland's political stability and cautious monetary stance.
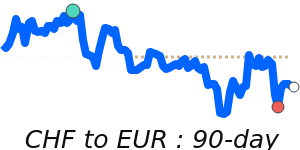
The Swiss National Bank continues to watch the franc's strength closely, signaling readiness to intervene if rapid appreciation threatens economic stability. While the franc's recent gains against the euro and other currencies have eased somewhat, it stays at elevated levels compared to its recent averages, highlighting its appeal as a safe asset.
For retail traders, expect the franc to remain resilient as global uncertainties persist. The USD/CHF pair could see some fluctuation, but unless new geopolitical or economic shocks emerge, the Swiss franc's safe-haven appeal and the dollar's moderate strength suggest a stay within recent ranges. Monitoring geopolitical developments and Swiss Central Bank signals will be key in anticipating future movements.
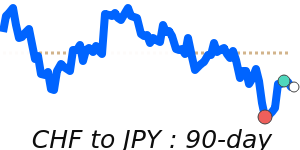
📊 Quick forecast view
⚪ Range-bound
1.2270 – 1.2490
🛡️ Safe-haven flows