CHF Market Update
18 Jul 2026 • 01:11 GMT
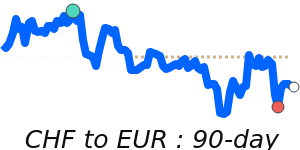
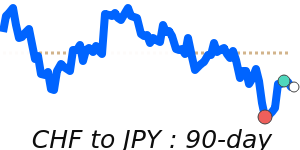
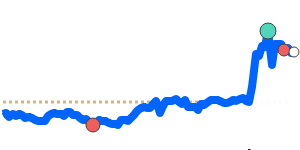
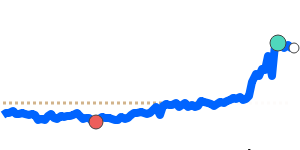
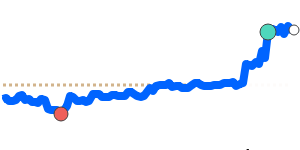
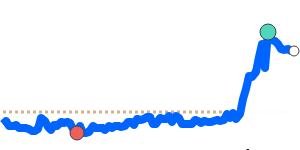
The Swiss franc remains relatively strong against the US dollar, trading at approximately 1.2381, which is about 1.7% below its three-month average of 1.2599. Despite recent stability within a broad range from 1.2274 to 1.2880, the franc's safe-haven appeal persists amid ongoing global uncertainties. The Swiss National Bank has kept its interest rate at zero and may step in if the franc continues to strengthen rapidly, aiming to support economic growth and price stability.
Meanwhile, the US dollar faces mixed influences. Rising energy prices and geopolitical tensions in the Middle East support the dollar, although recent weaker U.S. employment data have tempered its gains. Traders are closely watching upcoming U.S. inflation figures, which could shape next steps from the Federal Reserve.
Looking ahead, currency forecasts suggest the USD/CHF could decline further by the year's end, with some analysts predicting a move towards 0.78. Any surprise in US rate hikes or significant geopolitical developments could influence these projections. For now, the franc remains a preferred safe haven amid the uncertain global landscape.
📊 Quick forecast view
⚪ Range-bound
1.2270 – 1.2490
🛡️ Safe-haven flows