EUR Market Update
18 Jul 2026 • 01:10 GMT
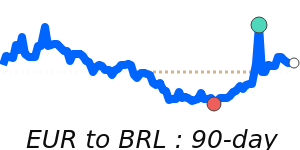
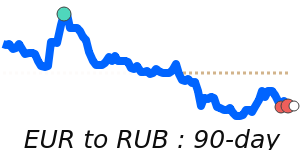
The euro remains around 1.1440 against the US dollar, slightly below its 3-month average of 1.1576. The pair has been trading in a narrow range, reflecting some indecision in the market. Traders are awaiting the European Central Bank's upcoming policy decision, but expectations suggest limited immediate support for the euro. Given the subdued price action and the pair's position below key moving averages, some caution is advised.
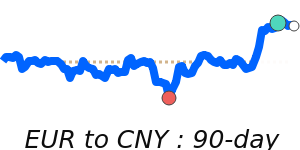
The euro also trades around 0.8506 against the British pound and just above its 3-month average against the Japanese yen, at 185.8. These stable ranges suggest the euro is holding steady despite brief swings linked to broader market themes.
In the near term, cautious traders are watching for any ECB signals that might influence the euro's direction, especially amid ongoing debates about interest rate hikes and eurozone growth prospects. For now, the euro's movement remains modest, mainly influenced by factors outside the currency's immediate fundamentals.
📊 Quick forecast view
🔴 Mild downside
1.1400 – 1.1580
🌍 Global risk sentiment
⚪ Range-bound