
Latest market analysis
EUR Market Update
29 Jul 2026 • 00:26 GMT
The euro remains below its recent 3-month average against the US dollar, trading at around 1.1384, about 1.3% weaker than the average of 1.1536. After recent stability, EUR/USD has been trading within a narrow range, indicating some caution among traders. The overall trend suggests a cautious tone ahead of upcoming US economic data and potential Federal Reserve moves. Sentiment is also influenced by geopolitical tensions and energy market volatility, which keep the dollar supported and the euro somewhat subdued.
Against other currencies, the euro showed strength near 0.8570 against the British pound and is close to its 3-month highs against the Swiss franc at 0.9332, indicating some regional divergence. Trading remains stable overall, with many pairs remaining within their typical ranges. Market focus remains on US monetary policy signals and geopolitical developments that could shape the euro’s next move. While some banks forecast a slight strengthening of the euro toward year-end, uncertainties remain, especially around US rate hikes and Eurozone economic data.
Forecast snapshot
Quick EUR/USD forecast
Near-term bias🔴 Mild downside
Expected range1.1360 – 1.1540
Dominant driver🌍 Global risk sentiment
3-month trend⚪ Range-bound
Stay informed
EUR news & insights
Recent analysis, guides and market developments relevant to the euro.


Rate direction
Euro to US dollar · EUR/USD trend
Review the recent market direction, current mid-market rate and significant movement alerts.
Compare before you exchange
Compare and save on EUR exchange rates
Exchange rates vary between banks and currency providers. Use the comparison below to understand total costs and potential savings against typical bank pricing.
Loading exchange rates...
|
|
|
||
|
|
|
||
|
|
|
||
|
|
|
Explore EUR pairs
Popular EUR exchange rates
Open a currency pair to view its live rate, comparison options, recent trend and market context.
1 EUR =1.1381USD

1D+0.1%▲
1 EUR =1.6034CAD

1D0.0%⬦
1 EUR =0.8565GBP

1D+0.2%▲
1 EUR =4.6542MYR

1D+0.2%▲
1 EUR =1.6430AUD
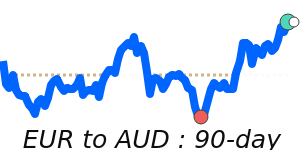
1D+0.4%▲
1 EUR =4.1796AED
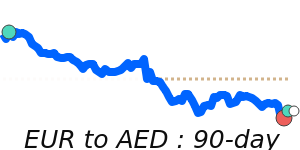
1D+0.1%▲
1 EUR =0.9334CHF
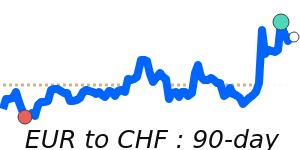
1D+0.2%▲
90dHighs
1 EUR =1.4716SGD
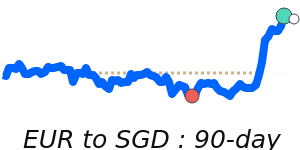
1D+0.2%▲