
Latest market analysis
HKD Market Update
01 Aug 2026 • 01:07 GMT
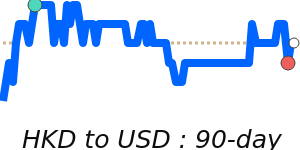
The Hong Kong dollar (HKD) remains near its 90-day lows against the US dollar, trading around 0.1275, close to its 3-month average. This stability reflects the HKD’s peg to the USD under the Linked Exchange Rate System, with the pair confined within a narrow range of 0.1275 to 0.1277. Despite recent USD strength driven by expectations of a hawkish Federal Reserve and supportive global factors, the HKD has held steady, largely tracking USD movements.
In the broader context, Hong Kong’s economy continues to show positive signs, including a fiscal surplus and record local currency bond issuance, which bolster confidence in its financial system. The HKD's close alignment with the USD means its prospects largely depend on US monetary policy developments. With USD expected to remain firm, especially if the Fed signals further rate hikes, the HKD is likely to stay within its current trading band unless significant US policy shifts occur.
Investors should monitor US economic data and Fed statements, as any unexpected change in US rate outlooks could influence the USD and, consequently, the HKD. Overall, the HKD remains stable, supported by policy and economic fundamentals, with limited short-term movement expected against the USD.
Stay informed
HKD news & insights
Recent analysis, guides and market developments relevant to the Hong Kong dollar.

Rate direction
US dollar to Hong Kong dollar · USD/HKD trend
Review the recent market direction, current mid-market rate and significant movement alerts.
Compare before you exchange
Compare and save on HKD exchange rates
Exchange rates vary between banks and currency providers. Use the comparison below to understand total costs and potential savings against typical bank pricing.
Loading exchange rates...
|
|
|
||
|
|
|
||
|
|
|
||
|
|
|
Explore HKD pairs
Popular HKD exchange rates
Open a currency pair to view its live rate, comparison options, recent trend and market context.
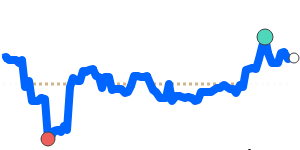
1 HKD =0.1275USD
1D0.0%⬦
90dLows
1 HKD =0.1104EUR
1D−0.1%▼
1 HKD =0.1787CAD
1D+0.2%▲
1 HKD =0.094562GBP
1D−0.1%▼
1 HKD =12.17INR
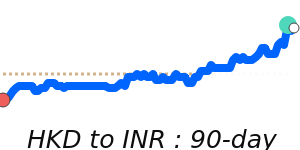
1D−0.2%▼
1 HKD =20.04JPY

1D−1.3%▼
1 HKD =0.1808AUD
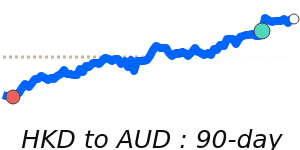
1D+0.2%▲
1 HKD =0.1635SGD
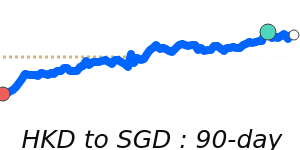
1D+0.2%▲
1 HKD =0.8609CNY
1D−0.1%▼
90dLows