NZD Market Update
13 Jul 2026 • 00:28 GMT
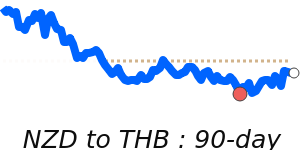
The New Zealand dollar (NZD) remains fairly steady against most major currencies. It’s currently trading at about 0.5758 against the US dollar, which is around 1.2% below its three-month average. This level has been within a relatively narrow range, highlighting recent stability, although it is somewhat softer than its recent highs near 0.5988.
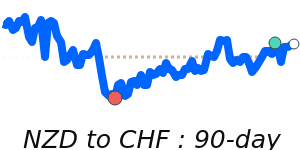
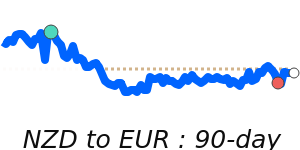
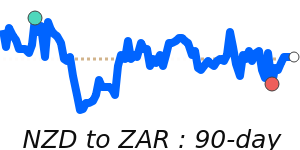
The NZD has seen some support from the Reserve Bank of New Zealand’s hawkish stance — recently raising interest rates and suggesting further tightening could be on the way. Because of this, the NZD has advanced against the euro and Swiss franc, trading near 0.505 and 0.466 respectively, both just above their three-month averages. Meanwhile, against the Australian dollar, the NZD hit 30-day highs around 0.8295, reflecting ongoing strength in the currency pair.
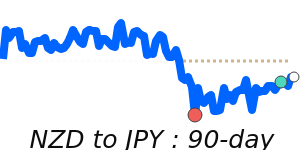
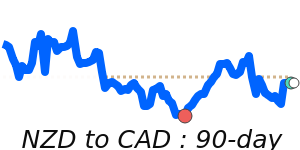
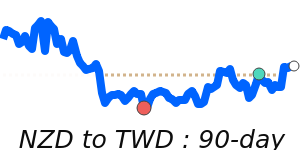
against the yen and Canadian dollar, the NZD remains relatively stable, trading near its three-month average. Overall, with the RBNZ signaling possible further hikes and the US dollar facing mixed signals from recent economic data, expect the NZD to trade within its current ranges in the near term. Any surprises from upcoming central bank meetings or US economic releases could influence future moves.
📊 Quick forecast view
🔴 Mild downside
0.5540 – 0.5760
🌍 Global risk sentiment
🟠 Range-bound, downside bias