NZD Market Update
20 Jul 2026 • 00:28 GMT
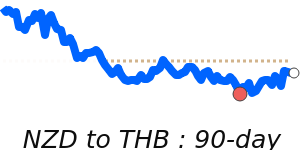
The New Zealand dollar is trading slightly above its three-month average against the US dollar at around 0.5840, reflecting recent stability in a 6.2% range. The RBNZ's recent hawkish tone, including a 25 basis point rate hike, continues to support the Kiwi, with market expectations for further tightening into mid-2027 boosting its strength. Domestic data such as strong manufacturing figures bolster confidence in the currency's outlook.
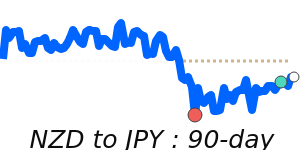
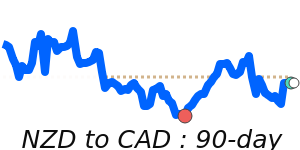
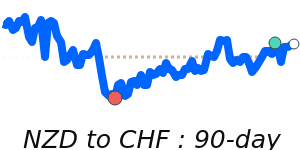
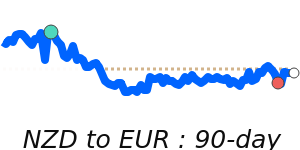
Against the euro, the NZD is at 30-day highs near 0.5110, above its average, helped by regional trade and economic fundamentals. Similarly, the NZD has climbed to 14-day highs near 0.4345 against the pound and just below recent highs against the yen at 94.94. The currency also remains resilient versus the Australian dollar at 0.8373 and the Canadian dollar at 0.8187, trading comfortably above recent averages.
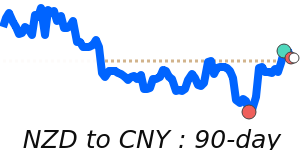
While the NZD continues its upward trend supported by local monetary policy and economic data, external factors such as U.S. rate expectations and Chinese demand remain key. Investors will keep an eye on upcoming economic releases and RBNZ guidance for further direction.
📊 Quick forecast view
🔴 Mild downside
0.5840 – 0.5990
🌍 Global risk sentiment
🟢 Uptrend