The New Zealand dollar (NZD) has started the week on a downtrend amid a risk-averse market sentiment, prompting investors to steer clear of the 'kiwi'. According to market analysts, this cautious behavior in trading is expected to persist as the Reserve Bank of New Zealand (RBNZ) prepares for its interest rate decision on Wednesday. This decision is paramount, as it may significantly influence NZD trading positions.
Recent geopolitical developments also raise concerns for the NZD. Speculations regarding the potential for a Trump presidency have surfaced, which could lead to renewed tariffs on trade partners such as Europe and China. These proposed tariffs could negatively impact demand for New Zealand's key exports, subsequently putting pressure on the NZD.
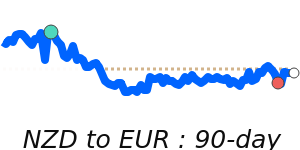
In terms of currency performance, the NZD/USD pair is currently trading at 0.5946, reflecting a modest 0.6% decrease from its three-month average of 0.5983. The pair has displayed stability, fluctuating within a narrow 4.2% range between 0.5855 and 0.6099. The NZD to EUR exchange rate stands at 0.5119, which is 2.0% below its three-month average of 0.5222, trading in a consistent 3.9% range from 0.5109 to 0.5309.
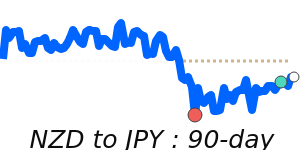
The NZD/GBP rate maintains a position just below its three-month average, fluctuating within a stable 2.4% range from 0.4396 to 0.4503, currently at 0.4427. In contrast, the NZD/JPY has shown a stronger performance, trading at 88.23, which is 1.9% above its three-month average of 86.6, and has exhibited a 4.9% range from 84.43 to 88.58.
Analysts suggest that the movements of the NZD are closely tied to its correlation with the AUD/USD, as both currencies are influenced by regional commodity markets. As traders prepare for upcoming economic announcements and potential interest rate changes, the NZD's direction will be closely monitored.