
Latest market analysis
SGD Market Update
27 Jul 2026 • 00:29 GMT
The Singapore dollar remains near 30-day highs against the US dollar, trading close to 0.7759. This level is slightly below its three-month average but reflects some resilience amid recent market fluctuations. Despite potential concerns over US monetary policy and external geopolitical tensions, the SGD has held steady within a narrow trading range from about 0.7708 to 0.7893 over the past month.
Market watchers are closely monitoring upcoming US economic data, including inflation figures and Federal Reserve comments, which could influence USD strength and, consequently, SGD movements. Additionally, any decisions by Singapore’s Monetary Authority later this year regarding policy tightening may support the SGD further.
Overall, the SGD continues to show stability, with only minor shifts against the US dollar. Investors should stay alert to new economic indicators and geopolitical developments that could drive volatility. While the current range suggests limited downside, a move above 0.7759 or below 0.7708 could signal a shift. As always, cautious positioning is advised in this dynamic environment.
Forecast snapshot
Quick SGD/USD forecast
Near-term bias🔴 Mild downside
Expected range0.7750 – 0.7890
Dominant driver🌍 Global risk sentiment
3-month trend⚪ Range-bound
Stay informed
SGD news & insights
Recent analysis, guides and market developments relevant to the Singapore dollar.


Rate direction
Singapore dollar to US dollar · SGD/USD trend
Review the recent market direction, current mid-market rate and significant movement alerts.
Compare before you exchange
Compare and save on SGD exchange rates
Exchange rates vary between banks and currency providers. Use the comparison below to understand total costs and potential savings against typical bank pricing.
Loading exchange rates...
|
|
|
||
|
|
|
||
|
|
|
||
|
|
|
Explore SGD pairs
Popular SGD exchange rates
Open a currency pair to view its live rate, comparison options, recent trend and market context.
1 SGD =0.7742USD

1d0.0%⬦
1 SGD =1.1088AUD

1d+0.2%▲
1 SGD =3.1646MYR

1d−0.1%▼
1 SGD =74.15INR

1d−0.8%▼
1 SGD =26.05THB
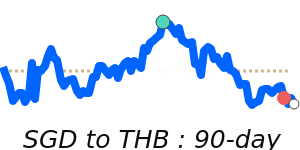
1d−0.1%▼
1 SGD =1,139.1KRW
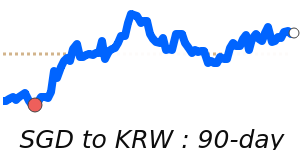
1d+0.4%▲
1 SGD =47.76PHP
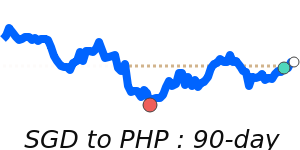
1d0.0%⬦
1 SGD =6.0709HKD
1d0.0%⬦