ZAR Market Update
20 Jul 2026 • 00:31 GMT
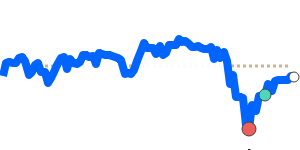
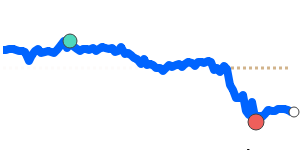
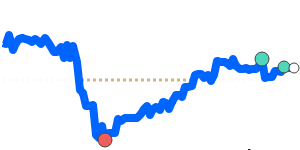
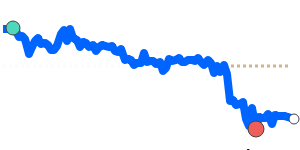
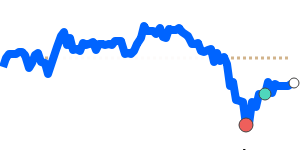
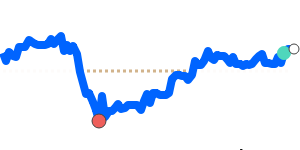
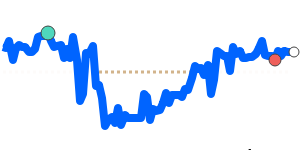
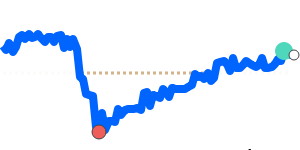
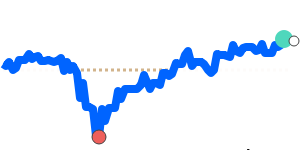
The South African rand has recently weakened slightly against the US dollar, trading near 0.06036, which is just below its 3-month average. This is a small move — the rand remains within a stable range, and recent data shows it traded mainly between 0.0589 and 0.0618.
Despite global uncertainties, the rand's weakness against the dollar is limited. Ongoing US economic strength, along with a strong dollar partly driven by geopolitical tensions, keeps the greenback supported. Meanwhile, the rand has benefited from positive domestic factors like improved economic outlook and prospects of interest rate cuts in South Africa.
Looking ahead, if the US economy remains resilient, the dollar may stay strong, putting some pressure on the rand. However, local political and economic developments, including potential rate cuts and a stable trade environment, could help support the rand in the coming weeks. For now, the rand's recent move near 0.06036 against the dollar suggests cautious optimism, but traders should stay alert to US data releases and geopolitical risks that could influence currency moves.
📊 Quick forecast view
🟢 Mild upside
0.0590 – 0.0610
🌍 Global risk sentiment
⚪ Range-bound