Switch .com Best Exchange Rates .com Best Exchange Rates .com Best Exchange Rates
BER

Asia - Key Exchange Rates

Latest mid-market exchange rates with 90-day UP/DOWN trends and HIGH/LOW alerts for the most popular Asian cross rates. Keep track of when currency rates are in your favour.

Get the latest exchange rates for key Asian currencies, including the Japanese Yen (JPY), Chinese Yuan (CNY), Indian Rupee (INR), and more. Whether you're conducting business across Asia, traveling, or staying ahead of market trends, our real-time updates and insights ensure you're always informed. Discover the most competitive rates and make smarter decisions for your currency exchanges with our trusted and up-to-date information.


US dollar to Japanese yen
USDJPY 90 day chart

USD to JPY at 155.5 is 2.0% above its 3-month average of 152.5, having traded in a relatively stable 7.6% range from 146.5 to 157.6
USD to JPY
155.76
1d−0.3%
 

US dollar to Indian rupee
USDINR 90 day chart

USD to INR is at 90-day highs near 90.25, 1.7% above its 3-month average of 88.77, having traded in a very stable 2.9% range from 87.74 to 90.25
USD to INR
90.53
1d+0.5%
90dHighs

US dollar to Chinese yuan
USDCNY 90 day chart

USD to CNY is at 90-day lows near 7.0581, just 0.7% below its 3-month average of 7.1088, having traded in a stable 1.1% range from 7.0581 to 7.1390
USD to CNY
7.0545
1d−0.1%
90dLows

US dollar to Philippine peso
USDPHP 90 day chart

USD to PHP is at 7-day lows near 58.90, just 0.8% above its 3-month average of 58.41, having traded in a quite stable 4.5% range from 56.81 to 59.37
USD to PHP
59.12
1d−0.3%
 

US dollar to Indonesian rupiah
USDIDR 90 day chart

USD to IDR is at 7-day lows near 16649, near its 3-month average, having traded in a very stable 2.4% range from 16377 to 16763
USD to IDR
16,634
1d0.0%
 

US dollar to Malaysian ringgit
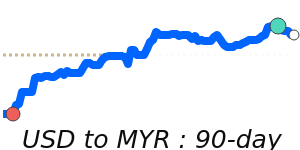
USDMYR 90 day chart

USD to MYR is at 90-day lows near 4.1105, 1.7% below its 3-month average of 4.1819, having traded in a very stable 2.9% range from 4.1105 to 4.2305
USD to MYR
4.0973
1d−0.1%
90dLows

US dollar to Thai baht
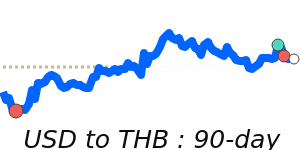
USDTHB 90 day chart

USD to THB is at 60-day lows near 31.63, 2.0% below its 3-month average of 32.27, having traded in a very stable 3.9% range from 31.61 to 32.85
USD to THB
31.54
1d−0.4%
60dLows

US dollar to Hong Kong dollar
USDHKD 90 day chart

USD to HKD is at 14-day lows near 7.7794, near its 3-month average, having traded in a stable 0.3% range from 7.7679 to 7.7904
USD to HKD
7.7825
1d0.0%
14dLows

US dollar to Singapore dollar
USDSGD 90 day chart

USD to SGD is at 60-day lows near 1.2917, just below its 3-month average, having traded in a very stable 2.5% range from 1.2759 to 1.3081
USD to SGD
1.2919
1d−0.1%
60dLows

US dollar to New Taiwan dollar
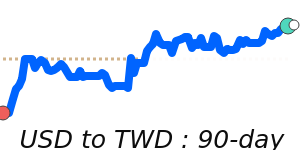
USDTWD 90 day chart

USD to TWD at 31.19 is 1.3% above its 3-month average of 30.8, having traded in a quite stable 4.6% range from 30.07 to 31.44
USD to TWD
31.33
1d+0.3%
14dLows

US dollar to South Korean won
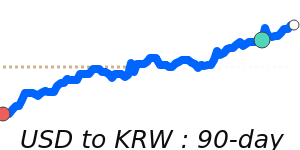
USDKRW 90 day chart

USD to KRW at 1473 is 2.6% above its 3-month average of 1436, having traded in a relatively stable 7.0% range from 1379 to 1475
USD to KRW
1,475.0
1d+0.6%
 

Australian dollar to US dollar
AUDUSD 90 day chart

AUD to USD at 0.6665 is 1.7% above its 3-month average of 0.6555, having traded in a very stable 3.7% range from 0.6444 to 0.6685
AUD to USD
0.6654
1d−0.2%
60dHighs

Australian dollar to Japanese yen
AUDJPY 90 day chart

AUD to JPY at 103.6 is 3.7% above its 3-month average of 99.9, having traded in a relatively stable 7.3% range from 97.12 to 104.2
AUD to JPY
103.64
1d−0.5%
 

Australian dollar to Thai baht
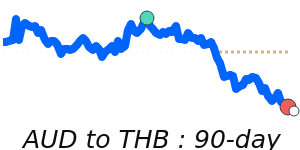
AUDTHB 90 day chart

AUD to THB is at 7-day lows near 21.07, just below its 3-month average, having traded in a very stable 3.0% range from 20.86 to 21.48
AUD to THB
20.99
1d−0.6%
 

Australian dollar to New Zealand dollar
AUDNZD 90 day chart

AUD to NZD is at 7-day lows near 1.1467, just 0.6% above its 3-month average of 1.1395, having traded in a very stable 3.8% range from 1.1157 to 1.1579
AUD to NZD
1.1465
1d−0.1%
 

New Zealand dollar to US dollar
NZDUSD 90 day chart

NZD to USD at 0.5811 is 1.0% above its 3-month average of 0.5753, having traded in a relatively stable 7.1% range from 0.5590 to 0.5989
NZD to USD
0.5804
1d−0.1%
60dHighs

View a full list of exchange rates by selecting your Base (from) currency: