
Latest market analysis
AUD Market Update
03 Aug 2026 • 00:27 GMT
The Australian dollar is trading near 30-day highs around 0.7047 against the US dollar, close to its three-month average. Recent trading has been quite stable within a 5.4% range between 0.6887 and 0.7258. Market attention is shifting as the USD strengthens ahead of the upcoming FOMC meeting, with the dollar regaining ground after some recent weakness. Expectations are for a hawkish tone from the Fed, which could support the dollar further.
While the AUD remains above key levels, investor sentiment is cautious ahead of Australian CPI data and global economic decisions from the US and China. The currency's short-term trend will likely hinge on these developments, with a break above 0.7000 potentially pushing the AUD higher if buoyed by regional fund flows and commodity price strength. Conversely, any signs of US rate hikes or global geopolitical tensions could limit gains. Overall, the AUD remains stable but watchful, with short-term fluctuations driven by global cues.
Forecast snapshot
Quick AUD/USD forecast
Near-term bias🔴 Mild downside
Expected range0.7050 – 0.7260
Dominant driver🌍 Global risk sentiment
3-month trend🟢 Uptrend
Stay informed
AUD news & insights
Recent analysis, guides and market developments relevant to the Australian dollar.


Rate direction
Australian dollar to US dollar · AUD/USD trend
Review the recent market direction, current mid-market rate and significant movement alerts.
Compare before you exchange
Compare and save on AUD exchange rates
Exchange rates vary between banks and currency providers. Use the comparison below to understand total costs and potential savings against typical bank pricing.
Loading exchange rates...
|
|
|
||
|
|
|
||
|
|
|
||
|
|
|
Explore AUD pairs
Popular AUD exchange rates
Open a currency pair to view its live rate, comparison options, recent trend and market context.
1 AUD =0.6996USD

1D+0.5%▲
1 AUD =0.6078EUR

1D+0.4%▲
1 AUD =109.75JPY

1D+0.5%▲
1 AUD =1.1929NZD

1D+0.1%▲
90dLows
1 AUD =66.68INR
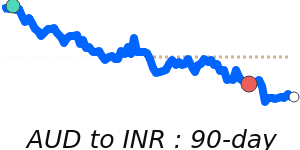
1D+0.4%▲
1 AUD =12,583IDR
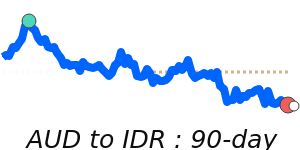
1D+0.5%▲
1 AUD =0.8975SGD
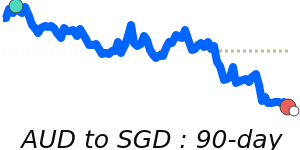
1D+0.2%▲
1 AUD =2.8652MYR
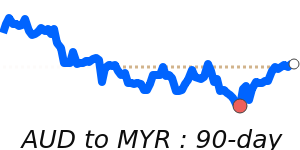
1D+0.5%▲