Switch .com Best Exchange Rates .com Best Exchange Rates .com Best Exchange Rates
BER

Middle East - Key Exchange Rates

Latest mid-market exchange rates with 90-day UP/DOWN trends and HIGH/LOW alerts for the most popular Middle East cross rates. Keep track of when currency rates are in your favour.

Explore the latest exchange rates for key Middle Eastern currencies, including the Kuwaiti Dinar (KWD), Saudi Riyal (SAR), UAE Dirham (AED), and others. Whether you're planning business transactions, travel, or monitoring economic trends, our up-to-date information provides a clear view of the region's diverse and robust currencies. Stay informed and make well-informed decisions for your currency exchange needs across the Middle East.

Middle East


United Arab Emirates dirham to Qatari rial
AED to QAR is at 7-day lows near 0.9910, near its 3-month average, having traded in a stable 1.9% range from 0.9816 to 1.0006
AED to QAR
0.9913
1d−0.4%

United Arab Emirates dirham to Saudi riyal
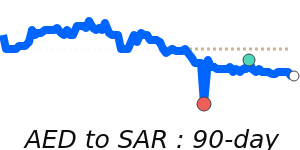
AEDSAR 90 day chart

AED to SAR is at 30-day highs near 1.0213, near its 3-month average, having traded in a stable 0.9% range from 1.0141 to 1.0231
AED to SAR
1.0212
30dHighs
1d0.0%

Omani rial to United Arab Emirates dirham
OMR to AED is at 30-day lows near 9.5508, near its 3-month average, having traded in a stable 1.2% range from 9.5104 to 9.6231
OMR to AED
9.5514
30dLows
1d0.0%

US dollar to United Arab Emirates dirham
USDAED 90 day chart

USD to AED is steady at its 3-month average 3.6727.
USD to AED
3.6725
1d0.0%

US dollar to Bahraini dinar
USDBHD 90 day chart

USD to BHD is at 14-day highs near 0.3771, near its 3-month average, having traded in a stable 1.3% range from 0.3737 to 0.3787
USD to BHD
0.3770
14dHighs
1d0.0%

US dollar to Egyptian pound
USDEGP 90 day chart

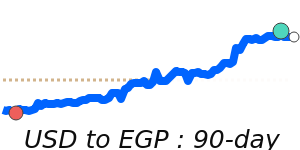
USD to EGP at 47.20 is 1.4% below its 3-month average of 47.89, having traded in a very stable 3.4% range from 46.98 to 48.60
USD to EGP
47.20
1d0.0%

US dollar to Israeli new sheqel
USDILS 90 day chart

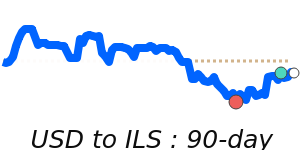
USD to ILS is at 90-day lows near 3.2003, 3.4% below its 3-month average of 3.3145, having traded in a relatively stable 6.7% range from 3.2003 to 3.4143
USD to ILS
3.2004
90dLows
1d−0.7%

US dollar to Iraqi dinar
USDIQD 90 day chart

USD to IQD is at 14-day highs near 1310, near its 3-month average, having traded in a stable 1.7% range from 1295 to 1317
USD to IQD
1,310.0
14dHighs
1d+0.1%

US dollar to Iranian rial
USDIRR 90 day chart

USD to IRR is at 90-day highs near 42125, near its 3-month average, having traded in a stable 0.3% range from 42006 to 42125
USD to IRR
42,113
90dHighs
1d0.0%

US dollar to Jordanian dinar
USD to JOD is steady at its 3-month average 0.709.
USD to JOD
0.7090
1d0.0%

US dollar to Kuwaiti dinar
USD to KWD is at 7-day highs near 0.3072, just above its 3-month average, having traded in a stable 1.1% range from 0.3040 to 0.3073
USD to KWD
0.3071
1d0.0%

US dollar to Omani rial
USDOMR 90 day chart

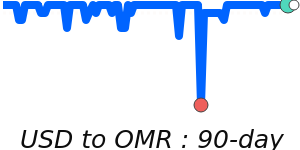
USD to OMR is at 30-day highs near 0.3845, near its 3-month average, having traded in a stable 1.2% range from 0.3816 to 0.3862
USD to OMR
0.3845
30dHighs
1d0.0%

US dollar to Saudi riyal
USDSAR 90 day chart

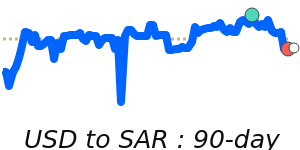
USD to SAR is at 30-day highs near 3.7507, near its 3-month average, having traded in a stable 0.9% range from 3.7242 to 3.7575
USD to SAR
3.7504
30dHighs
1d0.0%

US dollar to Turkish lira
USDTRY 90 day chart

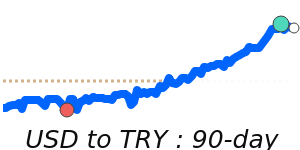
USD to TRY is at 90-day highs near 42.25, 1.7% above its 3-month average of 41.55, having traded in a very stable 3.6% range from 40.78 to 42.25
USD to TRY
42.25
90dHighs
1d+0.1%

US dollar to Yemeni rial
USD to YER is at 90-day lows near 238.5, just below its 3-month average, having traded in a stable 0.8% range from 238.5 to 240.3
USD to YER
238.55
90dLows
1d0.0%

View a full list of exchange rates by selecting your Base (from) currency: