Latest market analysis
MXN Market Update
03 Aug 2026 • 00:31 GMT
The Mexican peso is trading near 30-day highs against the US dollar, at around 0.057786, slightly above its 3-month average. The recent stability within a narrow range reflects a cautious outlook, with the peso supported by the Bank of Mexico's decision to hold interest rates steady. This move keeps carry-trade appeal alive, especially as global risk sentiment improves with positive developments in geopolitical relations, notably between Iran and the US.
Meanwhile, the US dollar has regained strength ahead of the upcoming Federal Reserve meeting, with markets expecting a hawkish update that could lead to further rate hikes. This has kept USD near yearly highs, putting pressure on the peso and other emerging market currencies.
Looking ahead, the peso's trajectory will likely depend on Banxico’s actual monetary policy moves and US Fed signals. If the dollar continues to strengthen, the peso could see some declines, but ongoing geopolitical optimism provides some support. Overall, the peso remains stable but watch for potential volatility based on global developments and policy guidance from both the Fed and Mexico’s central bank.
Forecast snapshot
Quick MXN/USD forecast
Near-term bias⚪ Range-bound
Expected range0.0570 – 0.0580
Dominant driver⚖️ Interest-rate differentials
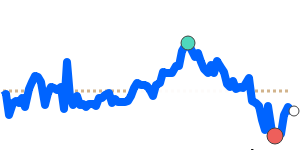
3-month trend🔴 Downtrend
Stay informed
MXN news & insights
Recent analysis, guides and market developments relevant to the Mexican peso.


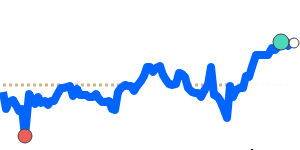
Rate direction
US dollar to Mexican peso · USD/MXN trend
Review the recent market direction, current mid-market rate and significant movement alerts.
Compare before you exchange
Compare and save on MXN exchange rates
Exchange rates vary between banks and currency providers. Use the comparison below to understand total costs and potential savings against typical bank pricing.
Loading exchange rates...
|
|
|
||
|
|
|
||
|
|
|
||
|
|
|
Explore MXN pairs
Popular MXN exchange rates
Open a currency pair to view its live rate, comparison options, recent trend and market context.
1 MXN =0.057679USD
1D+0.2%▲
1 MXN =0.050114EUR
1D+0.2%▲
1 MXN =0.081018CAD
1D+0.1%▲
1 MXN =0.042960GBP
1D+0.2%▲
1 MXN =5.4979INR
1D+0.2%▲
1 MXN =9.0484JPY
1D+0.3%▲
1 MXN =0.082447AUD
1D−0.2%▼
1 MXN =0.073996SGD
1D0.0%⬦
1 MXN =0.3895CNY
1D+0.2%▲