MYR Market Update
18 Jul 2026 • 01:16 GMT
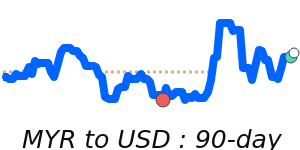
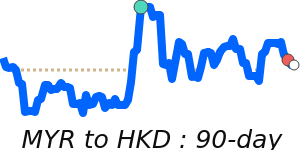
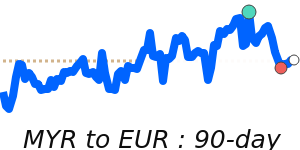
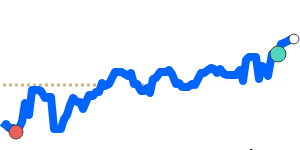
The Malaysian Ringgit (MYR) has recently weakened against the US dollar, trading near 14-day lows at around 0.2441. This marks a decline of about 2% from its three-month average of 0.249, reflecting a broader trend of USD strength supported by rising energy prices and geopolitical tensions in the Gulf. The dollar's resilience comes despite some cautiousness ahead of US inflation data and Federal Reserve policy signals.
Malaysia’s economy remains resilient, and recent reports suggest a positive outlook for the MYR. Expectations of steady growth, encouraged by strong FDI and supportive external conditions, continue to underpin the currency. Some analysts project the MYR could gradually appreciate against the dollar later in the year, with forecasts expecting USD/MYR to settle around 3.85–3.90 by year-end.
While the dollar's current support is notable, any shifts in US monetary policy or changes in energy prices could influence the MYR’s performance. For now, traders should watch the US CPI and geopolitical developments that could impact both currencies moving forward.
📊 Quick forecast view
🔴 Mild downside
0.2370 – 0.2440
🌍 Global risk sentiment
🟢 Uptrend