NOK Market Update
18 Jul 2026 • 01:13 GMT
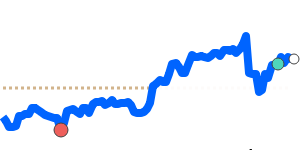
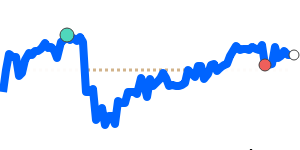
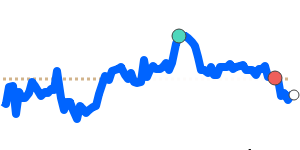
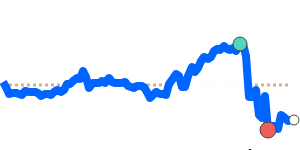
The Norwegian krone (NOK) has seen some notable movements against the US dollar, reaching 14-day highs near 0.1037. Despite this, the NOK remains slightly below its 3-month average of 0.1055. The recent volatility reflects the broader market environment, with the dollar supported by rising energy prices and geopolitical tensions in the Gulf, which tend to boost the dollar’s appeal, especially against currencies like NOK that are linked to oil exports.
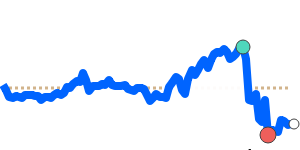
Oil price fluctuations continue to influence NOK's movement. A dip in oil prices has put some pressure on the krone, but investors are also keeping an eye on potential interest rate hikes from Norges Bank, which could lend support if they materialize. Meanwhile, the broader USD strength amid geopolitical tensions and energy market developments continues to weigh on NOK’s performance.
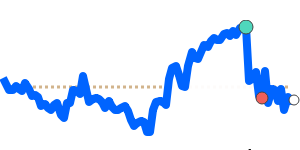
In the coming days, focus will remain on oil price trends and Norges Bank’s policy signals, as these are key factors that could drive NOK movements. For now, expect further volatility as markets respond to shifts in energy prices and global economic developments.
📊 Quick forecast view
🔴 Mild downside
0.1040 – 0.1090
🌍 Global risk sentiment
⚪ Range-bound