NZD Market Update
18 Jul 2026 • 01:11 GMT
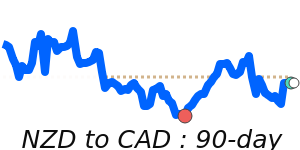
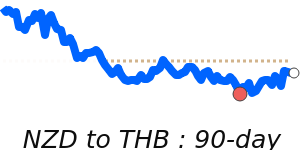
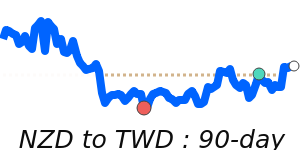
The New Zealand dollar (NZD) has been trending higher against the US dollar recently, trading at around 0.5843. This level is just above its recent three-month average and reflects the market's optimism about potential future rate hikes from the Reserve Bank of New Zealand (RBNZ). Expectations of tighter monetary policy, combined with a strong manufacturing sector, have supported the Kiwi’s recent gains, bringing it close to 0.5800 against the USD.
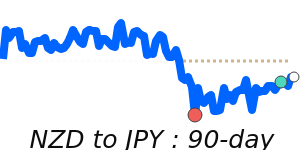
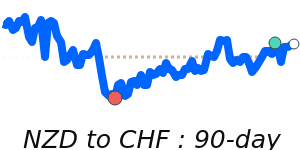
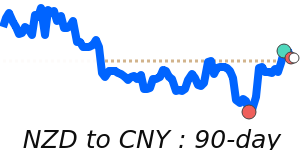
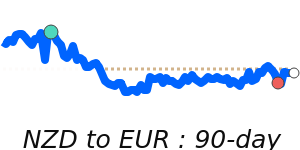
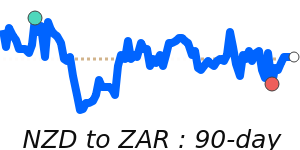
While the NZD has gained against the USD, it remains within a stable trading range, balancing positive economic signals with cautious investor sentiment amid geopolitical tensions and global risk concerns. The currency has also reached near 30-day highs against the euro and the Japanese yen, further indicating recent strength.
Looking ahead, traders will be watching upcoming RBNZ policy updates and economic data releases for clues on the currency's next move. Any shift in US Federal Reserve policy or unexpected global developments could influence the NZD’s trajectory in the coming weeks. Overall, the Kiwi remains resilient but will be sensitive to both domestic and international economic signals.
📊 Quick forecast view
🔴 Mild downside
0.5840 – 0.5990
🌍 Global risk sentiment
🟢 Uptrend