THB Market Update
18 Jul 2026 • 01:16 GMT
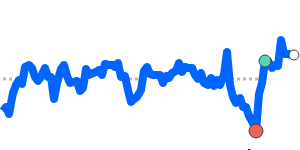
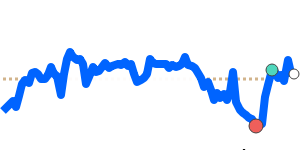
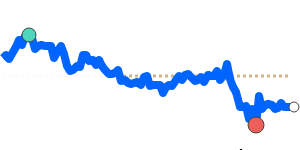
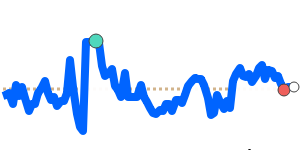
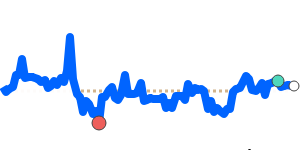
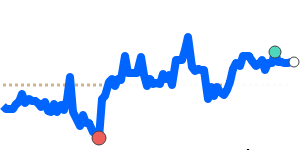
The Thai baht has experienced some movement against major currencies but remains relatively steady overall. against the US dollar, the baht is currently trading at about 0.029765, which is roughly 2.3% below its three-month average. This indicates the baht has weakened slightly in recent weeks but is still trading within a stable range.
Recent market factors include a supportive dollar driven by rising energy prices amid geopolitical tensions in the Gulf and strong US economic signals. Meanwhile, Thailand’s currency continues to feel pressure from domestic policies like tighter gold transaction controls and expected currency depreciation by some analysts.
Looking ahead, the baht’s performance will likely depend on global energy prices and Thailand’s monetary stance. The Bank of Thailand’s rate cut late last year and worries about a slowdown in economic growth could influence the currency’s trajectory. Nonetheless, recent political stability, following the February election, has helped keep the baht relatively resilient for now. Traders should keep an eye on these factors, as well as energy trends and US dollar strength, which could impact the baht’s direction in the coming weeks.