Switch .com Best Exchange Rates .com Best Exchange Rates .com Best Exchange Rates
BER

Exchange Rates & Currency Deals

GBP-USD Rate Calculator


Understanding the Table:

The comparison table above helps you see the total cost of your currency transaction by showing the exchange rates offered by different providers. It also makes it easy to spot potential savings from market-leading FX services compared to bank rates.

To see a full list of available providers, simply enter your transaction type, details and click ‘GET RATES’.


GBP to USD Market Data

British pound (GBP) to US dollar (USD) market data - latest interbank exchange rate, trend, chart & historic rates.

 
Sell GBP   →   Buy USD
1 GBP = 1.3377 USD
1d+0.1%
 
GBP to USD at 1.3439 is just 1.0% above its 3-month average of 1.3312, having traded in a very stable 4.0% range from 1.3019 to 1.3543
|
Tracker

GBP/USD sits near the top of a 3-month range with a bullish-to-range-bound bias. BoE remains cautious on rate cuts; the Fed is easing toward neutral, so a softer USD supports GBP. The pair may drift around current levels unless data surprises. Bias GBP/USD is above the 90-day average and sits in the upper half of the three-month range, giving a bullish-to-range-bound stance. Key drivers - Rate gap: BoE remains cautious with rate cuts later in the year, while the Fed is seen easing toward neutral; the modest gap helps the pound hold ground. - Risk appetite: Global risk mood and dollar moves can shift the pair; a firmer dollar tends to weigh on GBP, while a softer dollar supports it. - Macro: Upcoming US payrolls and unemployment data will shape Fed easing bets and the dollar’s direction. Range The pair has traded in a narrow band over the last three months and sits near the upper end, so it is likely to drift around current levels unless new data surprises. What could change it - Upside risk: stronger UK data or a more hawkish BoE stance could lift GBP. - Downside risk: firmer US data or a louder Fed tilt toward higher rates could lift the dollar and press GBP/USD lower


GBP to USD Conversion: What Is Your Money Worth?

To help you understand the real-world value of the current exchange rate, the table below shows how much British pound are worth in US dollar across a range of amounts.

This gives a quick view of what you’d get when converting different GBP amounts at today’s rate * :

GBP USD
£ 1 $ 1.3377
£ 5 $ 6.6885
£ 10 $ 13.38
£ 20 $ 26.75
£ 50 $ 66.89
£ 100 $ 133.77
£ 250 $ 334.43
£ 500 $ 668.85
£ 1,000 $ 1,338
£ 2,000 $ 2,675
£ 5,000 $ 6,689
£ 10,000 $ 13,377
£ 20,000 $ 26,754
£ 50,000 $ 66,885
£ 100,000 $ 133,770
GBP USD
£ 0.7475 $ 1
£ 3.7375 $ 5
£ 7.4750 $ 10
£ 14.95 $ 20
£ 37.38 $ 50
£ 74.75 $ 100
£ 186.88 $ 250
£ 373.75 $ 500
£ 747.50 $ 1,000
£ 1,495 $ 2,000
£ 3,738 $ 5,000
£ 7,475 $ 10,000
£ 14,950 $ 20,000
£ 37,375 $ 50,000
£ 74,750 $ 100,000

More amounts

*Converted at the current GBP-USD interbank exchange rate. Calculate actual payout amounts for Send Money and Travel Money exchange rates.


Is US dollar (USD) expected to go up or down?

This is always a difficult question as exchange rates are influenced by many factors, so a good method to consider the US dollar current value is to look the USD performance against a range of other currencies over various time periods.

The following table looks at the performance of the USD exchange rate against selections of other currencies over time periods from the previous 2 days back to the last 5 years.

Popular Rates (A - Z)


United Arab Emirates dirham to Indian rupee
AEDINR 90 day chart
AED to INR
24.61
1d−0.1%
14dHighs

Australian dollar to Chinese yuan
AUDCNY 90 day chart
AUD to CNY
4.6622
1d0.0%
14dLows

Australian dollar to Euro
AUDEUR 90 day chart
AUD to EUR
0.5768
1d0.0%
 

Australian dollar to British pound
AUDGBP 90 day chart
AUD to GBP
0.5003
1d−0.1%
 

Australian dollar to Japanese yen
AUDJPY 90 day chart
AUD to JPY
106.10
1d−0.4%
90dHighs

Australian dollar to New Zealand dollar
AUDNZD 90 day chart
AUD to NZD
1.1666
1d0.0%
 

Australian dollar to US dollar
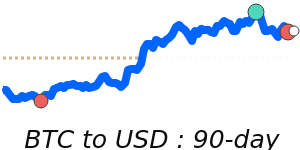
AUDUSD 90 day chart
AUD to USD
0.6692
1d0.0%
 

Canadian dollar to Australian dollar
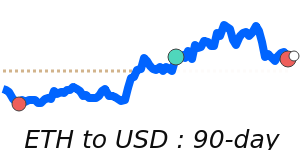
CADAUD 90 day chart
CAD to AUD
1.0746
1d0.0%
 

Euro to Canadian dollar
EURCAD 90 day chart
EUR to CAD
1.6134
1d0.0%
30dHighs

Euro to British pound
EURGBP 90 day chart
EUR to GBP
0.8673
1d−0.1%
 

Euro to US dollar
EURUSD 90 day chart
EUR to USD
1.1603
1d0.0%
 

British pound to US dollar
GBPUSD 90 day chart
GBP to USD
1.3377
1d+0.1%
 

British pound to US dollar
GBPUSD 90 day chart
GBP to USD
1.3377
1d+0.1%
 

Hong Kong dollar to Japanese yen
HKDJPY 90 day chart
HKD to JPY
20.33
1d−0.4%
90dHighs

New Zealand dollar to British pound
NZDGBP 90 day chart
NZD to GBP
0.4288
1d0.0%
30dLows

New Zealand dollar to US dollar
NZDUSD 90 day chart
NZD to USD
0.5737
1d0.0%
 

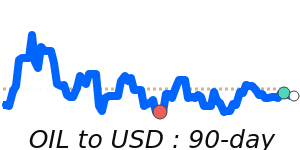
  Brent Crude Oil to US dollar
OILUSD 90 day chart
OIL to USD
 
66.18
1d+4.2%
90dHighs

US dollar to Canadian dollar
USDCAD 90 day chart
USD to CAD
1.3905
1d0.0%
 

US dollar to Swiss franc
USDCHF 90 day chart
USD to CHF
0.8037
1d−0.1%
30dHighs

US dollar to Chinese yuan
USDCNY 90 day chart
USD to CNY
6.9664
1d0.0%
90dLows

US dollar to Hong Kong dollar
USDHKD 90 day chart
USD to HKD
7.7980
1d−0.1%
90dHighs

US dollar to Japanese yen
USDJPY 90 day chart
USD to JPY
158.54
1d−0.4%
90dHighs

US dollar to Mexican peso
USDMXN 90 day chart
USD to MXN
17.73
1d−0.2%
90dLows

US dollar to Philippine peso
USDPHP 90 day chart
USD to PHP
59.57
1d+0.1%
30dHighs

US dollar to Singapore dollar
USDSGD 90 day chart
USD to SGD
1.2884
1d−0.1%
14dHighs
 

View a full list of exchange rates by selecting your Base (from) currency: