Switch .com Best Exchange Rates .com Best Exchange Rates .com Best Exchange Rates
BER

United Arab Emirates dirham Markets

AED Currency Update - Our review of United Arab Emirates dirham forecasts and news plus charts and historic rates. Check AED Trends over various time periods.


The UAE Dirham (AED) has seen pronounced fluctuations in recent weeks, influenced by various strategic developments and exchange rate trends. As of October 2, 2025, a notable currency swap agreement between the UAE and Turkey, valued at 18 billion AED, aims to bolster liquidity and enhance financial transactions between the two countries. Analysts believe this move will positively impact trade relations and could lead to stabilized exchange rates against the Turkish Lira.

In September 2025, Dubai's strategy to attract British property buyers amidst a weakened AED—approximately 8% lower against the British pound—has resulted in significant investments in the real estate sector. Reports indicate that British investments in Dubai properties surged by 62% year-on-year in Q2 2025, showcasing the effectiveness of this strategic shift during challenging economic conditions.

Recently, the UAE Central Bank's decision to cut interest rates by 0.25 percentage points has also prompted a positive market reaction, with both Dubai and Abu Dhabi stock indices rising post-announcement. This interest rate adjustment aligns with similar moves from the U.S. Federal Reserve and plays a crucial role in influencing currency exchange rates.

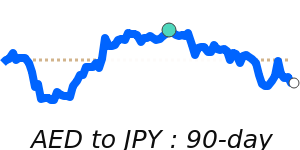
Current exchange rates indicate that the AED is stable against the US dollar, maintaining a steady position around its three-month average of 0.2723. against the Euro, the AED has reached 30-day highs at 0.2341, positioned just above its three-month average while trading within a stable 4.1% range. The performance against the British pound is slightly positive, with a recent high of 0.2032, reflecting a modest 0.5% increase over its three-month average. Furthermore, the AED is enjoying strength against the Japanese yen, trading at 41.55, which is 3.1% above its three-month average.

Overall, forecasters suggest that the combination of strategic agreements and monetary policy adjustments will likely support the stability of the AED in the near term, creating a conducive environment for both investors and traders engaged in international transactions.


US dollar to United Arab Emirates dirham - USD/AED Trend

 
USD to AED is steady at its 3-month average 3.6728.
|
 
1 USD =
3.6725We compare provider deals to this wholesale mid-market rate. Read more
AED
 
1d0.0%
 
Track Rate

View My Rate Tracker


Compare & Save on Exchange Rates

Exchange rates can vary significantly between banks and currency exchange providers, so it's important to compare rates from different sources before making a conversion.

The below table makes it easy to calculate and compare the Total Cost you are being charged on currency rates and the possible savings of using a foreign exchange provider rather than your bank.


Loading exchange rates...


Top AED Rates


United Arab Emirates dirham to US dollar
AEDUSD 90 day chart

AED to USD is steady at its 3-month average 0.2723.
AED to USD
0.2723
1d0.0%

United Arab Emirates dirham to Indian rupee
AEDINR 90 day chart

AED to INR is at 7-day highs near 24.17, 1.3% above its 3-month average of 23.85, having traded in a very stable 3.6% range from 23.34 to 24.19
AED to INR
24.17
1d0.0%

United Arab Emirates dirham to British pound
AEDGBP 90 day chart

AED to GBP is at 7-day highs near 0.2032, just 0.5% above its 3-month average of 0.2022, having traded in a very stable 3.4% range from 0.1995 to 0.2062
AED to GBP
0.2038
1d+0.2%

United Arab Emirates dirham to Pakistani rupee
AEDPKR 90 day chart

AED to PKR at 76.91 is just below its 3-month average, having traded in a stable 1.8% range from 76.28 to 77.67
AED to PKR
77.10
14dHighs
1d0.0%

United Arab Emirates dirham to Singapore dollar
AEDSGD 90 day chart

AED to SGD is at 60-day highs near 0.3528, just 0.8% above its 3-month average of 0.35, having traded in a stable 1.7% range from 0.3474 to 0.3534
AED to SGD
0.3530
60dHighs
1d+0.2%

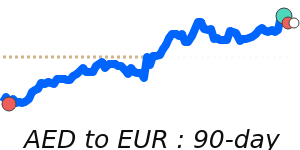
United Arab Emirates dirham to Euro
AEDEUR 90 day chart

AED to EUR is at 30-day highs near 0.2341, just above its 3-month average, having traded in a quite stable 4.1% range from 0.2294 to 0.2387
AED to EUR
0.2344
30dHighs
1d+0.2%

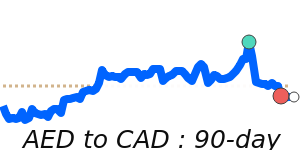
United Arab Emirates dirham to Canadian dollar
AEDCAD 90 day chart

AED to CAD at 0.3799 is 1.1% above its 3-month average of 0.3759, having traded in a very stable 2.7% range from 0.3702 to 0.3803
AED to CAD
0.3801
1d0.0%

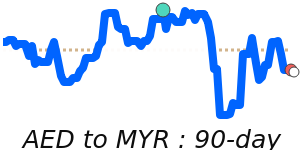
United Arab Emirates dirham to Malaysian ringgit
AEDMYR 90 day chart

AED to MYR is at 7-day highs near 1.1485, near its 3-month average, having traded in a very stable 2.1% range from 1.1404 to 1.1646
AED to MYR
1.1483
1d+0.1%

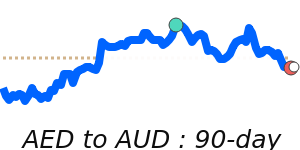
United Arab Emirates dirham to Australian dollar
AEDAUD 90 day chart

AED to AUD at 0.4134 is just 0.6% below its 3-month average of 0.4158, having traded in a quite stable 4.2% range from 0.4072 to 0.4241
AED to AUD
0.4139
1d−0.1%

A-Z


United Arab Emirates dirham to Australian dollar
AEDAUD 90 day chart

AED to AUD at 0.4134 is just 0.6% below its 3-month average of 0.4158, having traded in a quite stable 4.2% range from 0.4072 to 0.4241
AED to AUD
0.4139
1d−0.1%

United Arab Emirates dirham to Canadian dollar
AEDCAD 90 day chart

AED to CAD at 0.3799 is 1.1% above its 3-month average of 0.3759, having traded in a very stable 2.7% range from 0.3702 to 0.3803
AED to CAD
0.3801
1d0.0%

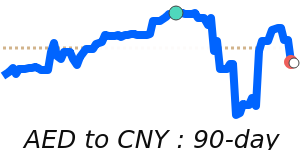
United Arab Emirates dirham to Chinese yuan
AEDCNY 90 day chart

AED to CNY is at 14-day lows near 1.9383, just below its 3-month average, having traded in a stable 1.5% range from 1.9341 to 1.9635
AED to CNY
1.9406
14dLows
1d0.0%

United Arab Emirates dirham to Euro
AEDEUR 90 day chart

AED to EUR is at 30-day highs near 0.2341, just above its 3-month average, having traded in a quite stable 4.1% range from 0.2294 to 0.2387
AED to EUR
0.2344
30dHighs
1d+0.2%

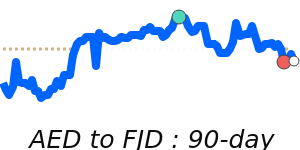
United Arab Emirates dirham to Fijian dollar
AEDFJD 90 day chart

AED to FJD is at 7-day highs near 0.6159, just above its 3-month average, having traded in a stable 2.0% range from 0.6072 to 0.6193
AED to FJD
0.6163
1d+0.1%

United Arab Emirates dirham to British pound
AEDGBP 90 day chart

AED to GBP is at 7-day highs near 0.2032, just 0.5% above its 3-month average of 0.2022, having traded in a very stable 3.4% range from 0.1995 to 0.2062
AED to GBP
0.2038
1d+0.2%

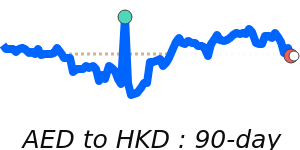
United Arab Emirates dirham to Hong Kong dollar
AEDHKD 90 day chart

AED to HKD is at 14-day highs near 2.1195, just below its 3-month average, having traded in a stable 1.0% range from 2.1155 to 2.1372
AED to HKD
2.1185
14dHighs
1d0.0%

United Arab Emirates dirham to Indian rupee
AEDINR 90 day chart

AED to INR is at 7-day highs near 24.17, 1.3% above its 3-month average of 23.85, having traded in a very stable 3.6% range from 23.34 to 24.19
AED to INR
24.17
1d0.0%

United Arab Emirates dirham to Japanese yen
AEDJPY 90 day chart

AED to JPY at 41.55 is 3.1% above its 3-month average of 40.29, having traded in a quite stable 4.4% range from 39.82 to 41.58
AED to JPY
41.67
90dHighs
1d+0.5%

United Arab Emirates dirham to Malaysian ringgit
AEDMYR 90 day chart

AED to MYR is at 7-day highs near 1.1485, near its 3-month average, having traded in a very stable 2.1% range from 1.1404 to 1.1646
AED to MYR
1.1483
1d+0.1%

United Arab Emirates dirham to Omani rial
AED to OMR is at 14-day lows near 0.1047, near its 3-month average, having traded in a stable 1.2% range from 0.1039 to 0.1051
AED to OMR
0.1047
14dLows
1d0.0%

United Arab Emirates dirham to Philippine peso
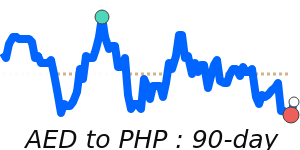
AEDPHP 90 day chart

AED to PHP at 15.79 is 1.3% above its 3-month average of 15.58, having traded in a very stable 3.3% range from 15.38 to 15.88
AED to PHP
15.88
1d−0.3%

United Arab Emirates dirham to Pakistani rupee
AEDPKR 90 day chart

AED to PKR at 76.91 is just below its 3-month average, having traded in a stable 1.8% range from 76.28 to 77.67
AED to PKR
77.10
14dHighs
1d0.0%

United Arab Emirates dirham to Qatari rial
AED to QAR at 0.9918 is near its 3-month average, having traded in a stable 1.5% range from 0.9816 to 0.9959
AED to QAR
0.9925
90dHighs
1d−0.1%

United Arab Emirates dirham to Saudi riyal
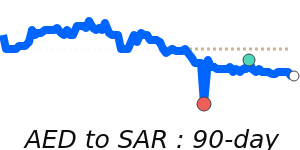
AEDSAR 90 day chart

AED to SAR at 1.0213 is near its 3-month average, having traded in a stable 0.7% range from 1.0163 to 1.0231
AED to SAR
1.0214
1d0.0%

United Arab Emirates dirham to Singapore dollar
AEDSGD 90 day chart

AED to SGD is at 60-day highs near 0.3528, just 0.8% above its 3-month average of 0.35, having traded in a stable 1.7% range from 0.3474 to 0.3534
AED to SGD
0.3530
60dHighs
1d+0.2%

United Arab Emirates dirham to Thai baht
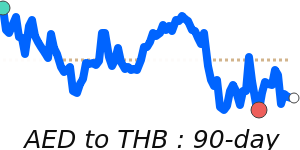
AEDTHB 90 day chart

AED to THB is at 30-day highs near 8.8686, just 0.9% above its 3-month average of 8.7878, having traded in a very stable 3.6% range from 8.6081 to 8.9159
AED to THB
8.8877
30dHighs
1d+0.2%

United Arab Emirates dirham to New Taiwan dollar
AED to TWD is at 30-day highs near 8.3193, 1.6% above its 3-month average of 8.1887, having traded in a quite stable 5.3% range from 7.9552 to 8.3739
AED to TWD
8.3108
30dHighs
1d0.0%

United Arab Emirates dirham to Vietnamese dong
AED to VND is at 30-day lows near 7177, just above its 3-month average, having traded in a stable 1.2% range from 7110 to 7198
AED to VND
7,175.1
30dLows
1d0.0%

United Arab Emirates dirham to South African rand
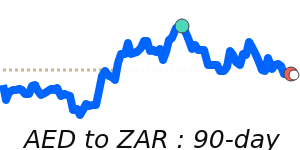
AEDZAR 90 day chart

AED to ZAR is at 90-day lows near 4.6706, 2.4% below its 3-month average of 4.7891, having traded in a relatively stable 6.2% range from 4.6706 to 4.9604
AED to ZAR
4.6821
90dLows
1d−0.4%