
Latest market analysis
AED Market Update
03 Aug 2026 • 00:33 GMT
The AED remains stable against the USD at its 3-month average of 0.2723, reflecting a consistent level amid global dollar strength. Recently, the US dollar has regained some ground ahead of the upcoming FOMC meeting, supported by expectations of further rate hikes. This renewed strength is likely to keep pressure on the AED/USD exchange rate in the near term.
In contrast, the AED has seen little fluctuation against currencies like the euro, British pound, and Australian dollar, remaining close to recent 30-day lows. Its performance against most major currencies has been quite stable, with only minor deviations within recent ranges.
Overall, the AED’s steady position against the USD suggests limited immediate volatility. Traders should watch US dollar developments and the FOMC's policy signals, as they will influence the dollar’s strength and, consequently, AED movements. For now, the currency pair remains resilient within its recent range, with no major shifts expected unless market conditions change.
Stay informed
AED news & insights
Recent analysis, guides and market developments relevant to the United Arab Emirates dirham.

Rate direction
US dollar to United Arab Emirates dirham · USD/AED trend
Review the recent market direction, current mid-market rate and significant movement alerts.
Compare before you exchange
Compare and save on AED exchange rates
Exchange rates vary between banks and currency providers. Use the comparison below to understand total costs and potential savings against typical bank pricing.
Loading exchange rates...
|
|
|
||
|
|
|
||
|
|
|
||
|
|
|
Explore AED pairs
Popular AED exchange rates
Open a currency pair to view its live rate, comparison options, recent trend and market context.
1 AED =0.2723USD

1D0.0%⬦
1 AED =25.92INR

1D0.0%⬦
1 AED =0.2022GBP

1D−0.1%▼
1 AED =75.36PKR

1D+0.1%▲
90dLows
1 AED =0.3490SGD

1D−0.2%▼
1 AED =0.2362EUR
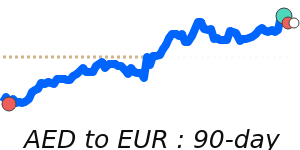
1D0.0%⬦
1 AED =0.3821CAD
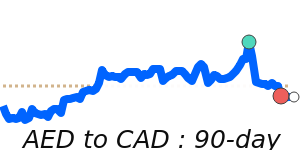
1D−0.1%▼
1 AED =1.1143MYR
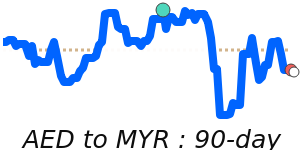
1D0.0%⬦
1 AED =0.3873AUD
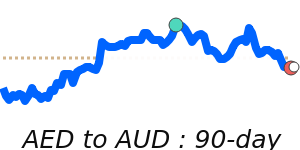
1D−0.4%▼