
Latest market analysis
GBP Market Update
29 Jul 2026 • 00:27 GMT
The British pound has recently fallen to 14-day lows against the US dollar, trading near 1.3283. While this is below its three-month average of 1.3395, the move remains within a stable trading range. The market is focused on the Bank of England, which is expected to hold interest rates steady at 3.75% amid ongoing economic and political uncertainties. Recent energy price increases and fiscal policy debates are adding to the cautious mood, though the BOE's signals of possible future tightening are keeping sterling supported.
Against the euro, the pound is also near 14-day lows at around 1.1669, reflecting quiet trading within its recent range. Meanwhile, the GBP has managed to stay above its 3-month average against the Japanese yen, trading around 217.6, supported by global risk sentiment and stable market conditions.
Overall, GBP remains steady within its recent ranges despite some downward pressure. Investors are watching UK economic data and the outlook for UK monetary policy, which could influence the pound’s next moves. The currency’s future direction will largely depend on how domestic politics and global energy markets evolve in the coming weeks.
Forecast snapshot
Quick GBP/USD forecast
Near-term bias🔴 Mild downside
Expected range1.2940 – 1.3280
Dominant driver🌍 Global risk sentiment
3-month trend⚪ Range-bound
Stay informed
GBP news & insights
Recent analysis, guides and market developments relevant to the British pound.


Rate direction
British pound to US dollar · GBP/USD trend
Review the recent market direction, current mid-market rate and significant movement alerts.
Compare before you exchange
Compare and save on GBP exchange rates
Exchange rates vary between banks and currency providers. Use the comparison below to understand total costs and potential savings against typical bank pricing.
Loading exchange rates...
|
|
|
||
|
|
|
||
|
|
|
||
|
|
|
Explore GBP pairs
Popular GBP exchange rates
Open a currency pair to view its live rate, comparison options, recent trend and market context.
1 GBP =1.3287USD

1D0.0%⬦
1 GBP =1.1675EUR
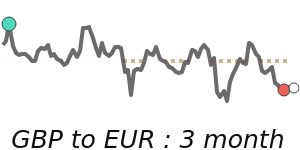
1D−0.2%▼
1 GBP =1.9182AUD
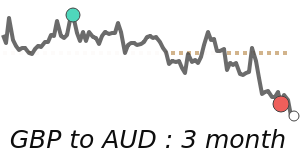
1D+0.2%▲
1 GBP =1.8720CAD
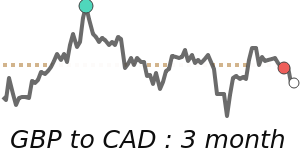
1D−0.1%▼
1 GBP =127.30INR
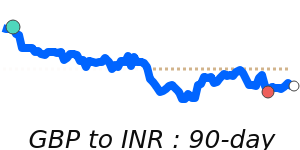
1D−0.2%▼
1 GBP =62.98TRY
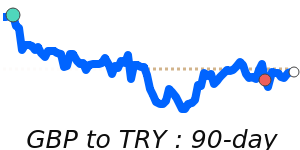
1D+0.1%▲
1 GBP =4.8797AED

1D0.0%⬦
1 GBP =2.3043NZD
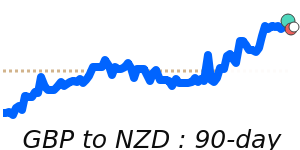
1D−0.2%▼
1 GBP =5.4338MYR
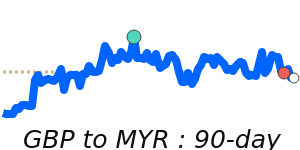
1D0.0%⬦
1 GBP =22.32ZAR
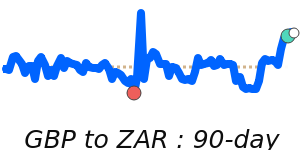
1D−0.4%▼