
Latest market analysis
GBP Market Update
03 Aug 2026 • 00:26 GMT
The British Pound remains near recent highs against the US dollar, trading around 1.3493, close to its 14-day peak. This level is just 0.7% above the 3-month average, indicating a relatively stable range overall. Despite ongoing UK political uncertainties and economic pressures, the GBP has showed resilience thanks in part to expectations that the Bank of England may continue to raise interest rates. Meanwhile, the dollar has strengthened ahead of the upcoming Federal Reserve meeting, with traders anticipating a hawkish message that could support further US dollar gains.
Looking ahead, markets are watching for additional UK economic data, which could influence the GBP as well as any signals from the Bank of England regarding future rate hikes. Flat to slightly higher GBP levels may persist if the UK economy continues to show resilience, but unexpected geopolitical or energy price shocks could impact the currency.
Overall, GBP remains within a narrow but sustained trading range, supported by monetary policy prospects and cautious optimism about the UK outlook, while the dollar's positioning will likely depend on US economic developments and Fed policy signals.
Forecast snapshot
Quick GBP/USD forecast
Near-term bias⚪ Range-bound
Expected range1.3400 – 1.3630
Dominant driver⚖️ Interest-rate differentials
3-month trend🟢 Uptrend
Stay informed
GBP news & insights
Recent analysis, guides and market developments relevant to the British pound.


Rate direction
British pound to US dollar · GBP/USD trend
Review the recent market direction, current mid-market rate and significant movement alerts.
Compare before you exchange
Compare and save on GBP exchange rates
Exchange rates vary between banks and currency providers. Use the comparison below to understand total costs and potential savings against typical bank pricing.
Loading exchange rates...
|
|
|
||
|
|
|
||
|
|
|
||
|
|
|
Explore GBP pairs
Popular GBP exchange rates
Open a currency pair to view its live rate, comparison options, recent trend and market context.
1 GBP =1.3426USD

1D+0.1%▲
1 GBP =1.1665EUR
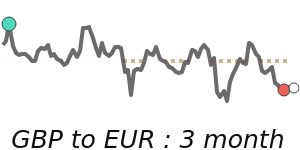
1D0.0%⬦
1 GBP =1.9191AUD
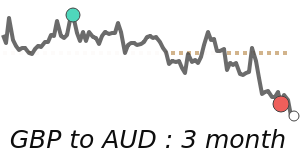
1D−0.4%▼
1 GBP =1.8859CAD
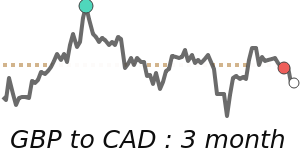
1D−0.1%▼
1 GBP =127.98INR
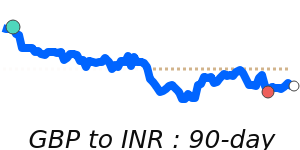
1D+0.1%▲
1 GBP =63.81TRY
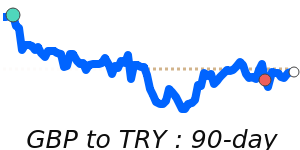
1D+0.1%▲
90dHighs
1 GBP =4.9314AED

1D+0.1%▲
1 GBP =2.2893NZD
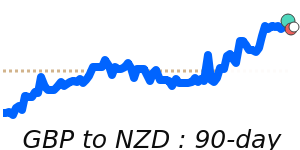
1D−0.3%▼
1 GBP =5.4987MYR
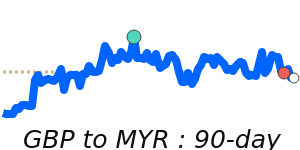
1D+0.1%▲
1 GBP =22.21ZAR
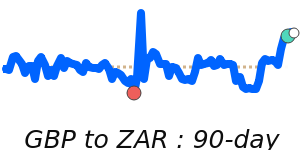
1D−0.5%▼