ZAR Market Update
18 Jul 2026 • 01:15 GMT
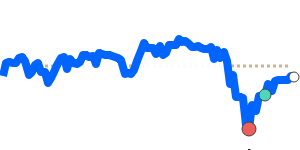
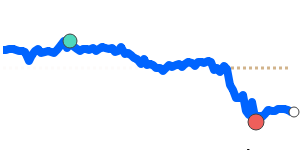
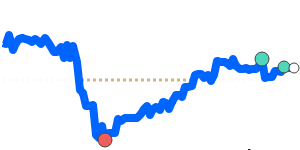
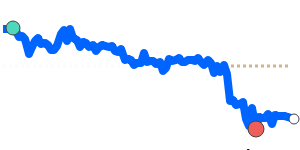
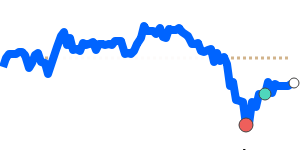
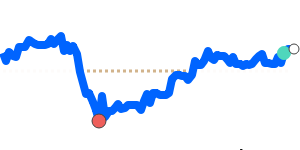
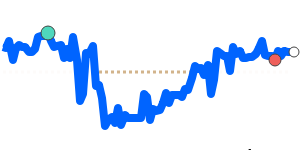
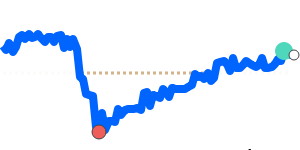
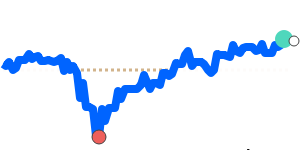
The South African rand has recently traded near 14-day lows against the US dollar, around 0.06055, just below its three-month average. Despite this dip, the rand remains within a stable 4.9% range, and recent improvement in South Africa’s economic outlook—supported by better electricity supply and cautious interest rate easing—has helped stabilize its position.
Meanwhile, the US dollar continues to be supported by rising energy prices amid ongoing geopolitical tensions in the Gulf, which push oil prices higher. This energy-driven support has kept the dollar firm against many currencies, although weaker US employment data has tempered some of these gains.
For now, the rand’s proximity to recent lows reflects cautious market sentiment amid global energy concerns and upcoming US inflation data. If energy prices stay elevated, the dollar could receive continued support, potentially limiting rand gains. Conversely, positive local economic signals and possible interest rate cuts may support a modest recovery. Keep an eye on global energy trends and US inflation reports, as these will influence whether the rand can push higher or remains under pressure.
📊 Quick forecast view
🟢 Mild upside
0.0590 – 0.0610
🌍 Global risk sentiment
⚪ Range-bound