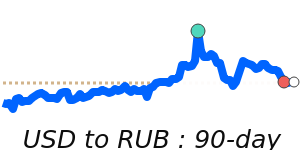
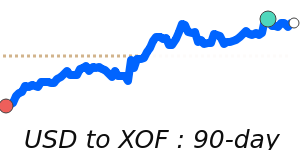
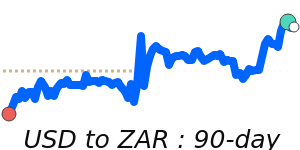
USD Market Update
16 Jul 2026 • 00:28 GMT
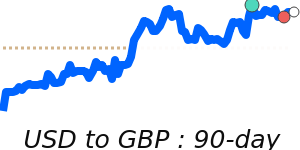
The US dollar remains broadly steady against major currencies with some recent movement. The USD is near 14-day lows versus the euro at around 0.872, slightly above its three-month average. Despite this, the dollar continues to benefit from safe-haven demand amid geopolitical tensions, particularly in the Middle East, which have supported the dollar and lifted oil prices.
Investors are also paying attention to upcoming US economic data, including CPI inflation, which could influence Federal Reserve policy. The FOMC minutes are expected to reinforce a hawkish stance, helping to underpin the dollar in the near term. However, weaker-than-expected jobs reports in recent weeks have added some caution to dollar strength expectations.
In addition, the dollar is holding near recent lows against the Canadian dollar at 1.404 and the Australian dollar at 1.427, indicating some broader stability in the market. Still, fluctuations remain within a relatively narrow range, with traders closely watching US data and geopolitical developments for clues on whether the dollar can regain upward momentum or remain rangebound in the near term.
📊 Quick forecast view
🔴 Mild downside
0.8340 – 0.8720
🌍 Global risk sentiment
⚪ Range-bound