Switch .com Best Exchange Rates .com Best Exchange Rates .com Best Exchange Rates
BER

ICICI Bank Transfers Compared

INR-USD Rate Calculator


Understanding the Table:

The comparison table above helps you see the total cost of your ICICI Bank currency transaction by showing the exchange rates offered by different providers. It also makes it easy to spot potential savings from market-leading FX services compared to bank rates.

To see a full list of available providers, simply enter your transaction type, details and click ‘GET RATES’.


Compare ICICI Bank Exchange Rates & Fees - Save Time & Money


Our ICICI Bank INR to USD rate is 0.0112. This is -2% below the mid-rate.


INR to USD Market Data

Indian rupee (INR) to US dollar (USD) market data - latest interbank exchange rate, trend, chart & historic rates.

 
Sell INR   →   Buy USD
INR to USD at 0.011462 is 1.5% below its 3-month average of 0.011642, having traded in a quite stable 4.1% range from 0.011405 to 0.011873
|
Tracker

Is the INR to USD Exchange Rate Likely to Improve?

Predicting exchange rate movements is always challenging, as they’re influenced by a wide range of economic and geopolitical factors. One useful way to assess the current value of the Indian rupee against the US dollar is to review how the INR/USD rate has changed over time.

The table below shows the percentage change in the INR to USD exchange rate across various timeframes—from the past 2 weeks to the last 20 years:

DateINR/USDPeriod
19 Jul 2025
0.0116
2 Week
04 May 2025
0.0118
3 Month
02 Aug 2024
0.0119
1 Year
03 Aug 2020
0.0133
5 Year
05 Aug 2015
0.0157
10 Year
07 Aug 2005
0.0230
20 Year
INR/USD historic rates
USD/INR hits 87.25, 1.6% above the 3-month avg, signaling a stronger dollar amid weak U.S. job growth and concerns of interest rate cuts. With energy prices rising and geopolitical tensions, analysts caution on INR's stability. Monitor upcoming economic data closely


INR to USD Conversion: What Is Your Money Worth?

To help you understand the real-world value of the current exchange rate, the table below shows how much Indian rupee are worth in US dollar across a range of amounts.

This gives a quick view of what you’d get when converting different INR amounts at today’s rate * :

INR USD
₹ 1 $ 0.0114
₹ 5 $ 0.0572
₹ 10 $ 0.1143
₹ 20 $ 0.2286
₹ 50 $ 0.5716
₹ 100 $ 1.1431
₹ 250 $ 2.8578
₹ 500 $ 5.7155
₹ 1,000 $ 11.43
₹ 2,000 $ 22.86
₹ 5,000 $ 57.16
₹ 10,000 $ 114.31
₹ 20,000 $ 228.62
₹ 50,000 $ 571.55
₹ 100,000 $ 1,143
INR USD
87.48 $ 1
437.40 $ 5
874.80 $ 10
1,750 $ 20
4,374 $ 50
8,748 $ 100
21,870 $ 250
43,740 $ 500
87,480 $ 1,000
174,960 $ 2,000
437,400 $ 5,000
874,800 $ 10,000
1,749,600 $ 20,000
4,374,000 $ 50,000
8,748,000 $ 100,000

More amounts

*Converted at the current INR-USD interbank exchange rate. Calculate actual payout amounts for Send Money and Travel Money exchange rates.


Is US dollar (USD) expected to go up or down?

This is always a difficult question as exchange rates are influenced by many factors, so a good method to consider the US dollar current value is to look the USD performance against a range of other currencies over various time periods.

The following table looks at the performance of the USD exchange rate against selections of other currencies over time periods from the previous 2 days back to the last 5 years.

Popular Rates (A - Z)


United Arab Emirates dirham to Indian rupee
AEDINR 90 day chart

AED to INR at 23.75 is 1.5% above its 3-month average of 23.39, having traded in a quite stable 4.1% range from 22.93 to 23.87
AED to INR
23.82
+0.1%

Australian dollar to Chinese yuan
AUDCNY 90 day chart

AUD to CNY at 4.6658 is near its 3-month average, having traded in a very stable 3.2% range from 4.5899 to 4.7378
AUD to CNY
4.6523

Australian dollar to Euro
AUDEUR 90 day chart

AUD to EUR at 0.5584 is 1.0% below its 3-month average of 0.5643, having traded in a quite stable 4.4% range from 0.5544 to 0.5786
AUD to EUR
0.5600
+0.1%

Australian dollar to British pound
AUDGBP 90 day chart

AUD to GBP at 0.4869 is 1.0% above its 3-month average of 0.4821, having traded in a very stable 2.9% range from 0.4759 to 0.4895
AUD to GBP
0.4881

Australian dollar to Japanese yen
AUDJPY 90 day chart

AUD to JPY is at 14-day lows near 95.29, just 0.8% above its 3-month average of 94.54, having traded in a quite stable 5.2% range from 92.31 to 97.13
AUD to JPY
95.78
14d-lows

Australian dollar to New Zealand dollar
AUDNZD 90 day chart

AUD to NZD is at 14-day highs near 1.0941, just 0.8% above its 3-month average of 1.0851, having traded in a stable 2.0% range from 1.0762 to 1.0977
AUD to NZD
1.0965
14d-highs

Australian dollar to US dollar
AUDUSD 90 day chart

AUD to USD at 0.6470 is just below its 3-month average, having traded in a very stable 3.6% range from 0.6372 to 0.6602
AUD to USD
0.6480

Bitcoin to US dollar
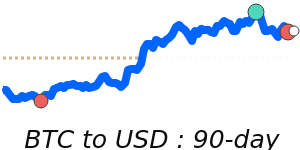
BTCUSD 90 day chart

BTC to USD at 114216 is 4.8% above its 3-month average of 108961, having traded in a highly volatile 27.7% range from 94245 to 120350
BTC to USD
114,349
+1.4%
14d-lows

Canadian dollar to Australian dollar
CADAUD 90 day chart

CAD to AUD at 1.1220 is near its 3-month average, having traded in a very stable 2.3% range from 1.1089 to 1.1343
CAD to AUD
1.1202
+0.2%

Etherium to US dollar
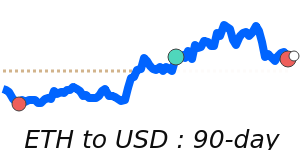
ETHUSD 90 day chart

ETH to USD at 3495 is 25.8% above its 3-month average of 2779, having traded in a highly volatile 115.3% range from 1776 to 3824
ETH to USD
3,532.4
+2.2%
14d-lows

Euro to Canadian dollar
EURCAD 90 day chart

EUR to CAD at 1.5962 is just 0.9% above its 3-month average of 1.5813, having traded in a very stable 4.0% range from 1.5494 to 1.6119
EUR to CAD
1.5941
-0.2%

Euro to British pound
EURGBP 90 day chart

EUR to GBP at 0.8719 is 2.0% above its 3-month average of 0.8544, having traded in a quite stable 4.4% range from 0.8383 to 0.8754
EUR to GBP
0.8716
-0.1%

Euro to Japanese yen
EURJPY 90 day chart

EUR to JPY at 170.7 is 1.8% above its 3-month average of 167.6, having traded in a relatively stable 7.3% range from 161.9 to 173.7
EUR to JPY
171.02
-0.1%

Euro to US dollar
EURUSD 90 day chart

EUR to USD at 1.1587 is just 0.7% above its 3-month average of 1.1508, having traded in a relatively stable 6.5% range from 1.1087 to 1.1807
EUR to USD
1.1571

British pound to US dollar
GBPUSD 90 day chart

GBP to USD at 1.3288 is 1.3% below its 3-month average of 1.3469, having traded in a quite stable 4.3% range from 1.3176 to 1.3746
GBP to USD
1.3275

British pound to US dollar
GBPUSD 90 day chart

GBP to USD at 1.3288 is 1.3% below its 3-month average of 1.3469, having traded in a quite stable 4.3% range from 1.3176 to 1.3746
GBP to USD
1.3275

Hong Kong dollar to Japanese yen
HKDJPY 90 day chart

HKD to JPY is at 7-day lows near 18.77, 1.0% above its 3-month average of 18.58, having traded in a quite stable 5.6% range from 18.19 to 19.20
HKD to JPY
18.83
-0.1%

New Zealand dollar to British pound
NZDGBP 90 day chart

NZD to GBP is at 7-day lows near 0.4450, near its 3-month average, having traded in a very stable 2.2% range from 0.4396 to 0.4494
NZD to GBP
0.4452

New Zealand dollar to US dollar
NZDUSD 90 day chart

NZD to USD at 0.5914 is 1.2% below its 3-month average of 0.5984, having traded in a quite stable 4.2% range from 0.5855 to 0.6099
NZD to USD
0.5910

  Brent Crude Oil to US dollar
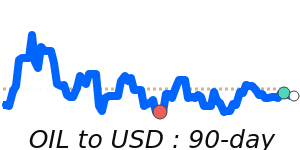
OILUSD 90 day chart

OIL to USD at 69.30 is 1.7% above its 3-month average of 68.15, having traded in a highly volatile 31.1% range from 60.14 to 78.85
OIL to USD
 
69.42
-0.5%

US dollar to Canadian dollar
USDCAD 90 day chart

USD to CAD at 1.3778 is just above its 3-month average, having traded in a very stable 3.0% range from 1.3571 to 1.3983
USD to CAD
1.3777
-0.2%

US dollar to Swiss franc
USDCHF 90 day chart

USD to CHF at 0.8040 is 1.1% below its 3-month average of 0.8127, having traded in a relatively stable 6.9% range from 0.7911 to 0.8455
USD to CHF
0.8059

US dollar to Chinese yuan
USDCNY 90 day chart

USD to CNY is at 60-day highs near 7.2118, just above its 3-month average, having traded in a stable 1.9% range from 7.1569 to 7.2950
USD to CNY
7.1796
60d-highs

US dollar to Hong Kong dollar
USDHKD 90 day chart

USD to HKD is at 90-day highs near 7.8502, near its 3-month average, having traded in a stable 1.3% range from 7.7501 to 7.8502
USD to HKD
7.8500
90d-highs

US dollar to Japanese yen
USDJPY 90 day chart

USD to JPY is at 7-day lows near 147.3, 1.2% above its 3-month average of 145.6, having traded in a quite stable 5.8% range from 142.4 to 150.7
USD to JPY
147.80
-0.1%

US dollar to Mexican peso
USDMXN 90 day chart

USD to MXN at 18.87 is just 0.8% below its 3-month average of 19.02, having traded in a relatively stable 6.3% range from 18.54 to 19.70
USD to MXN
18.86
+0.1%

US dollar to Philippine peso
USDPHP 90 day chart

USD to PHP at 57.72 is 2.4% above its 3-month average of 56.38, having traded in a quite stable 5.0% range from 55.34 to 58.10
USD to PHP
57.49
-0.1%

US dollar to Singapore dollar
USDSGD 90 day chart

USD to SGD at 1.2882 is near its 3-month average, having traded in a very stable 2.7% range from 1.2716 to 1.3061
USD to SGD
1.2875
-0.1%
 

View a full list of exchange rates by selecting your Base (from) currency: