Switch .com Best Exchange Rates .com Best Exchange Rates .com Best Exchange Rates
BER

US dollar Markets

USD Currency Update - Our review of US dollar forecasts and news plus charts and historic rates. Check USD Trends over various time periods.


The US dollar (USD) is currently under pressure due to increasing concerns about the economic trajectory in the United States. Analysts noted that uncertainty surrounding President Trump's upcoming nominee for the Federal Reserve Chair contributes further to this downward trend. Market participants are particularly attentive to initial jobless claims data released last week; any signs hinting at labor market weakness could bolster expectations for a Federal Reserve rate cut, adversely affecting the USD.

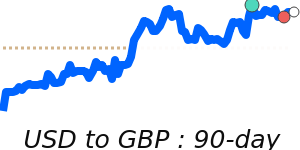
Recent data shows that the USD to EUR exchange rate has reached 7-day lows around 0.8574, which is 1.3% below its 3-month average of 0.8684. This pair has exhibited relative stability within a 6.5% range between 0.8470 and 0.9019. Meanwhile, the USD to GBP is also at 7-day lows near 0.7486, a modest 0.8% above its 3-month average of 0.7424, trading within a narrower range of 4.3% from 0.7275 to 0.7590. In contrast, the USD to JPY is slightly stronger at 147.2, which is 1.0% above its 3-month average of 145.7, fluctuating within a range of 5.8% from 142.5 to 150.7.

Oil prices, which have historically impacted the euro, are also worth noting as they influence overall market sentiment towards the dollar. Currently, oil is priced at $66.89 per barrel, 2.1% below its 3-month average of $68.31, having moved within a significantly volatile range that spans 25.6% from $62.78 to $78.85. Rising oil prices generally bolster demand for the USD, particularly as the dollar is the preferred currency for global oil transactions.

Financial experts suggest that the future strength of the USD hinges on the Federal Reserve's monetary policy moves, inflation trends, and broader economic performance. With persistent geopolitical tensions contributing to the USD's safe-haven status, this currency remains pivotal in shaping global financial markets despite ongoing discussions around de-dollarization. As global uncertainties continue, market participants will likely keep a close watch on key economic indicators to inform their trading strategies.


US Dollar Index - USD/X Trend

 
The U.S. Dollar Index is at 7-day lows near 98.19, just 0.5% below its 3-month average of 98.7, having traded in a quite stable 5.3% range from 96.64 to 101.8
|
 
1 USD =
98.16We compare provider deals to this wholesale mid-market rate. Read more
X
 
-0.6%
 
Track Rate

View My Rate Tracker


Compare & Save on Exchange Rates

Exchange rates can vary significantly between banks and currency exchange providers, so it's important to compare rates from different sources before making a conversion.

The below table makes it easy to calculate and compare the Total Cost you are being charged on currency rates and the possible savings of using a foreign exchange provider rather than your bank.


Loading exchange rates...


Top USD Rates


US dollar to Canadian dollar
USDCAD 90 day chart

USD to CAD is at 7-day lows near 1.3740, near its 3-month average, having traded in a very stable 3.0% range from 1.3571 to 1.3983
USD to CAD
1.3736
-0.2%

US dollar to Euro
USDEUR 90 day chart

USD to EUR is at 7-day lows near 0.8574, 1.3% below its 3-month average of 0.8684, having traded in a relatively stable 6.5% range from 0.8470 to 0.9019
USD to EUR
0.8570
-0.8%

US dollar to Japanese yen
USDJPY 90 day chart

USD to JPY at 147.2 is 1.0% above its 3-month average of 145.7, having traded in a quite stable 5.8% range from 142.5 to 150.7
USD to JPY
147.32
-0.3%

US dollar to Mexican peso
USDMXN 90 day chart

USD to MXN is at 7-day lows near 18.60, 2.0% below its 3-month average of 18.98, having traded in a quite stable 5.9% range from 18.54 to 19.64
USD to MXN
18.60
-0.7%

US dollar to Indian rupee
USDINR 90 day chart

USD to INR at 87.76 is 2.0% above its 3-month average of 86.01, having traded in a very stable 3.4% range from 84.95 to 87.86
USD to INR
87.72
90d-highs

US dollar to British pound
USDGBP 90 day chart

USD to GBP is at 7-day lows near 0.7486, just 0.8% above its 3-month average of 0.7424, having traded in a quite stable 4.3% range from 0.7275 to 0.7590
USD to GBP
0.7482
-0.4%

US dollar to Australian dollar
USDAUD 90 day chart

USD to AUD at 1.5385 is near its 3-month average, having traded in a very stable 3.6% range from 1.5146 to 1.5694
USD to AUD
1.5351
-0.4%

US dollar to Philippine peso
USDPHP 90 day chart

USD to PHP at 57.31 is 1.6% above its 3-month average of 56.43, having traded in a quite stable 5.0% range from 55.34 to 58.10
USD to PHP
57.21
-0.3%

A-Z


US dollar to Australian dollar
USDAUD 90 day chart

USD to AUD at 1.5385 is near its 3-month average, having traded in a very stable 3.6% range from 1.5146 to 1.5694
USD to AUD
1.5351
-0.4%

US dollar to Brunei dollar
USD to BND at 1.2865 is near its 3-month average, having traded in a very stable 2.7% range from 1.2709 to 1.3050
USD to BND
1.2817
-0.2%

US dollar to Brazilian real
USDBRL 90 day chart

USD to BRL is at 14-day lows near 5.4587, 1.9% below its 3-month average of 5.5668, having traded in a quite stable 5.8% range from 5.4096 to 5.7250
USD to BRL
5.4608
-0.9%
14d-lows

US dollar to Canadian dollar
USDCAD 90 day chart

USD to CAD is at 7-day lows near 1.3740, near its 3-month average, having traded in a very stable 3.0% range from 1.3571 to 1.3983
USD to CAD
1.3736
-0.2%

US dollar to Swiss franc
USDCHF 90 day chart

USD to CHF at 0.8060 is just 0.8% below its 3-month average of 0.8122, having traded in a relatively stable 6.9% range from 0.7911 to 0.8455
USD to CHF
0.8057
-0.2%

US dollar to Chilean peso
USDCLP 90 day chart

USD to CLP is at 90-day highs near 975.6, 3.1% above its 3-month average of 946.1, having traded in a quite stable 5.4% range from 926.0 to 975.6
USD to CLP
970.87
+1.0%
90d-highs

US dollar to Chinese yuan
USDCNY 90 day chart

USD to CNY at 7.1826 is near its 3-month average, having traded in a stable 1.0% range from 7.1569 to 7.2254
USD to CNY
7.1803

US dollar to Czech Republic horuna
USDCZK 90 day chart

USD to CZK is at 7-day lows near 21.07, 2.0% below its 3-month average of 21.5, having traded in a relatively stable 7.9% range from 20.87 to 22.52
USD to CZK
21.06
-0.8%

US dollar to Danish krone
USDDKK 90 day chart

USD to DKK is at 7-day lows near 6.3992, 1.2% below its 3-month average of 6.4793, having traded in a relatively stable 6.5% range from 6.3200 to 6.7285
USD to DKK
6.3964
-0.7%

US dollar to Egyptian pound
USDEGP 90 day chart

USD to EGP at 48.45 is 2.4% below its 3-month average of 49.63, having traded in a quite stable 5.3% range from 48.33 to 50.91
USD to EGP
48.47

US dollar to Euro
USDEUR 90 day chart

USD to EUR is at 7-day lows near 0.8574, 1.3% below its 3-month average of 0.8684, having traded in a relatively stable 6.5% range from 0.8470 to 0.9019
USD to EUR
0.8570
-0.8%

US dollar to Fijian dollar
USDFJD 90 day chart

USD to FJD is at 7-day lows near 2.2564, near its 3-month average, having traded in a very stable 3.2% range from 2.2327 to 2.3048
USD to FJD
2.2544
-0.3%

US dollar to British pound
USDGBP 90 day chart

USD to GBP is at 7-day lows near 0.7486, just 0.8% above its 3-month average of 0.7424, having traded in a quite stable 4.3% range from 0.7275 to 0.7590
USD to GBP
0.7482
-0.4%

US dollar to Hong Kong dollar
USDHKD 90 day chart

USD to HKD is at 90-day highs near 7.8502, near its 3-month average, having traded in a stable 1.0% range from 7.7738 to 7.8502
USD to HKD
7.8496
90d-highs

US dollar to Hungarian forint
USDHUF 90 day chart

USD to HUF is at 7-day lows near 341.1, 2.1% below its 3-month average of 348.4, having traded in a fairly volatile 8.3% range from 337.2 to 365.1
USD to HUF
341.15
-0.9%

US dollar to Indonesian rupiah
USDIDR 90 day chart

USD to IDR is at 7-day lows near 16354, near its 3-month average, having traded in a very stable 3.3% range from 16159 to 16699
USD to IDR
16,303
-0.2%

US dollar to Israeli new sheqel
USDILS 90 day chart

USD to ILS at 3.4298 is just 0.6% below its 3-month average of 3.4521, having traded in a fairly volatile 8.9% range from 3.3170 to 3.6113
USD to ILS
3.4385
-0.8%
30d-highs

US dollar to Indian rupee
USDINR 90 day chart

USD to INR at 87.76 is 2.0% above its 3-month average of 86.01, having traded in a very stable 3.4% range from 84.95 to 87.86
USD to INR
87.72
90d-highs

US dollar to Japanese yen
USDJPY 90 day chart

USD to JPY at 147.2 is 1.0% above its 3-month average of 145.7, having traded in a quite stable 5.8% range from 142.5 to 150.7
USD to JPY
147.32
-0.3%

US dollar to South Korean won
USDKRW 90 day chart

USD to KRW is at 7-day lows near 1385, just 0.5% above its 3-month average of 1378, having traded in a quite stable 4.7% range from 1353 to 1417
USD to KRW
1,383.5
-0.1%

US dollar to Sri Lankan rupee
USDLKR 90 day chart

USD to LKR at 300.8 is just above its 3-month average, having traded in a stable 1.9% range from 296.7 to 302.4
USD to LKR
299.68

US dollar to Mexican peso
USDMXN 90 day chart

USD to MXN is at 7-day lows near 18.60, 2.0% below its 3-month average of 18.98, having traded in a quite stable 5.9% range from 18.54 to 19.64
USD to MXN
18.60
-0.7%

US dollar to Malaysian ringgit
USDMYR 90 day chart

USD to MYR is at 30-day lows near 4.2215, just 0.6% below its 3-month average of 4.2483, having traded in a very stable 3.4% range from 4.1975 to 4.3385
USD to MYR
4.2295
-0.1%
30d-lows

US dollar to Norwegian krone
USDNOK 90 day chart

USD to NOK at 10.19 is just above its 3-month average, having traded in a quite stable 5.6% range from 9.90 to 10.45
USD to NOK
10.17
-0.7%

US dollar to New Zealand dollar
USDNZD 90 day chart

USD to NZD is at 7-day lows near 1.6865, just 0.9% above its 3-month average of 1.6718, having traded in a quite stable 4.2% range from 1.6396 to 1.7079
USD to NZD
1.6819
-0.4%

US dollar to Philippine peso
USDPHP 90 day chart

USD to PHP at 57.31 is 1.6% above its 3-month average of 56.43, having traded in a quite stable 5.0% range from 55.34 to 58.10
USD to PHP
57.21
-0.3%

US dollar to Pakistani rupee
USDPKR 90 day chart

USD to PKR at 283.4 is near its 3-month average, having traded in a stable 1.8% range from 280.2 to 285.3
USD to PKR
282.84

US dollar to Polish zloty
USDPLN 90 day chart

USD to PLN is at 7-day lows near 3.6638, just 0.9% below its 3-month average of 3.6975, having traded in a relatively stable 6.3% range from 3.6005 to 3.8276
USD to PLN
3.6622
-0.9%

US dollar to Qatari rial
USD to QAR at 3.6415 is near its 3-month average, having traded in a stable 1.1% range from 3.6165 to 3.6566
USD to QAR
3.6315

US dollar to Russian ruble
USDRUB 90 day chart

USD to RUB at 80.01 is just 1.0% above its 3-month average of 79.23, having traded in a fairly volatile 9.5% range from 75.31 to 82.50
USD to RUB
80.00

US dollar to Saudi riyal
USDSAR 90 day chart

USD to SAR is at 30-day highs near 3.7525, near its 3-month average, having traded in a stable 0.4% range from 3.7406 to 3.7568
USD to SAR
3.7526
30d-highs

US dollar to Solomon Islands dollar
USD to SBD is at 90-day lows near 8.2171, 1.3% below its 3-month average of 8.324, having traded in a stable 1.7% range from 8.2171 to 8.3544
USD to SBD
8.2171
-0.3%
90d-lows

US dollar to Swedish krona
USDSEK 90 day chart

USD to SEK is at 7-day lows near 9.6030, near its 3-month average, having traded in a very stable 4.0% range from 9.4470 to 9.8221
USD to SEK
9.6067
-0.7%

US dollar to Singapore dollar
USDSGD 90 day chart

USD to SGD is at 7-day lows near 1.2851, near its 3-month average, having traded in a very stable 2.7% range from 1.2716 to 1.3061
USD to SGD
1.2842
-0.2%

US dollar to Thai baht
USDTHB 90 day chart

USD to THB at 32.35 is just 0.8% below its 3-month average of 32.61, having traded in a very stable 4.0% range from 32.17 to 33.46
USD to THB
32.32

US dollar to Turkish lira
USDTRY 90 day chart

USD to TRY is at 90-day highs near 40.67, 2.5% above its 3-month average of 39.68, having traded in a quite stable 5.3% range from 38.61 to 40.67
USD to TRY
40.68
90d-highs

US dollar to New Taiwan dollar
USDTWD 90 day chart

USD to TWD is at 60-day highs near 29.93, just 0.9% above its 3-month average of 29.67, having traded in a quite stable 5.3% range from 28.93 to 30.45
USD to TWD
29.84
+0.1%
60d-highs

US dollar to Ukrainian hryvnia
USD to UAH at 41.60 is near its 3-month average, having traded in a stable 1.7% range from 41.16 to 41.88
USD to UAH
41.44
-0.3%

US dollar to Vietnamese dong
USDVND 90 day chart

USD to VND is at 90-day highs near 26243, just 0.6% above its 3-month average of 26088, having traded in a stable 1.3% range from 25913 to 26243
USD to VND
26,220
90d-highs

US dollar to Samoan tala
USD to WST is at 14-day highs near 2.7716, just 0.7% below its 3-month average of 2.7918, having traded in a very stable 2.2% range from 2.7390 to 2.8000
USD to WST
2.7716
14d-highs

US dollar to Central African franc
USDXAF 90 day chart

USD to XAF is at 7-day lows near 562.4, 1.2% below its 3-month average of 569.6, having traded in a relatively stable 6.5% range from 555.6 to 591.6
USD to XAF
562.15
-0.7%

US dollar to West African franc
USDXOF 90 day chart

USD to XOF is at 7-day lows near 562.4, 1.2% below its 3-month average of 569.6, having traded in a relatively stable 6.5% range from 555.6 to 591.6
USD to XOF
562.15
-0.7%

US dollar to CFP franc
USD to XPF is at 7-day lows near 102.3, 1.3% below its 3-month average of 103.6, having traded in a relatively stable 6.4% range from 101.1 to 107.6
USD to XPF
102.27
-0.8%

US dollar to South African rand
USDZAR 90 day chart

USD to ZAR at 17.79 is just 0.5% below its 3-month average of 17.88, having traded in a quite stable 4.5% range from 17.52 to 18.31
USD to ZAR
17.75
-0.7%