USD Market Update
07 Jul 2026 • 00:27 GMT
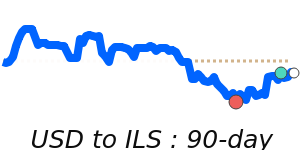
The US dollar recently traded near its 14-day lows against the euro, with USD/EUR around 0.8740. While this is a significant dip, it's still about 1.5% above the three-month average of 0.8613. The currency pair has been fairly stable within a tight 3.9% range, reflecting cautious market sentiment.
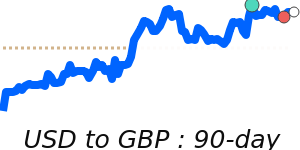
In addition, USD has also fallen against the pound to around 0.7466, and against the yen at approximately 162.1. The dollar's decline against these currencies highlights overall market uncertainty, especially as traders await upcoming economic data and policy signals.
Meanwhile, the dollar remains near its recent highs versus the Canadian dollar at 1.4216, indicating some continued safe-haven flows amid ongoing market jitters. The USD has stayed within its recent trading range, showing no drastic moves but maintaining a cautious tone ahead of key inflation reports and Federal Reserve signals.
Overall, the dollar's recent declines suggest traders are becoming more cautious, but with economic data still due, volatility may persist. Keep an eye on upcoming reports as these could influence whether the dollar stabilizes or extends its recent declines.
📊 Quick forecast view
🔴 Mild downside
0.8330 – 0.8740
🌍 Global risk sentiment
⚪ Range-bound