NZD Market Update
15 Jun 2026 • 00:28 GMT
The New Zealand dollar has lifted to a 7-day high near 0.5855 against the US dollar, close to its 3-month average. This upward move follows the Reserve Bank of New Zealand’s hawkish tone, which signals the potential for further interest rate hikes. Meanwhile, the US dollar remains firm, supported by rising oil prices and strong employment data that have pushed it to two-month highs and expectations of possible Fed rate increases.
Despite global uncertainties, the NZD has traded within a narrow range recently, reflecting a cautious market. The pairing's near-term outlook is influenced by the tug of war between RBNZ’s tightening signals and broad USD strength. Analysts suggest that if U.S. rate hikes accelerate, the NZD could face downward pressure, but if the RBNZ proceeds with policy tightening, downside risks may be limited.
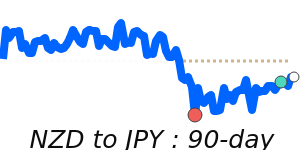
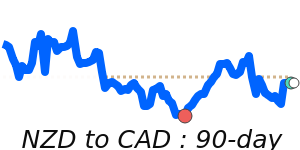
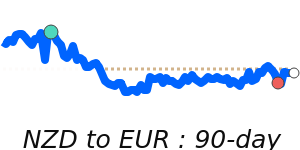
In other currency moves, the NZD has also reached multi-week highs against the euro, yen, and Canadian dollar, underscoring a generally positive momentum. Market participants should keep an eye on upcoming NZ economic data and RBNZ remarks, as well as U.S. inflation figures and Federal Reserve signals that could shift trend directions.
📊 Quick forecast view
🔴 Mild downside
0.5860 – 0.5990
⚖️ Interest-rate differentials
🟢 Uptrend